USD/JPY Price Analysis: Buyers lose steam, as price approaches the bottom of a rising wedge
- USD/JPY wobbles in a 70-pip range but stays in losing territory, down 0.27%.
- Risk appetite dented demand for the greenback, which stumbles by almost 0.80%, as shown by the US Dollar Index.
- USD/JPY Price Analysis: Rising wedge in the daily chart might open the door toward July’s lows around 134.70s.
The USD/JPY falls for the second straight day, hitting a daily low near 137.89, amidst an upbeat sentiment, as shown by global equities climbing; while the greenback recoils from 108.000, as demonstrated by the US Dollar Index, tumbling almost 0.80%, at 107.192.
The USD/JPY is exchanging hands at 138.09, seesawing within a narrower 70-pip range, which witnessed the major hitting a daily high at 138.57 before diving and piercing below 138.00, but once the dust settled, buyers reclaimed the 138.00 mark on a thin liquidity day because Japanese markets were closed on Monday, and no economic data was released.
USD/JPY Price Analysis: Technical outlook
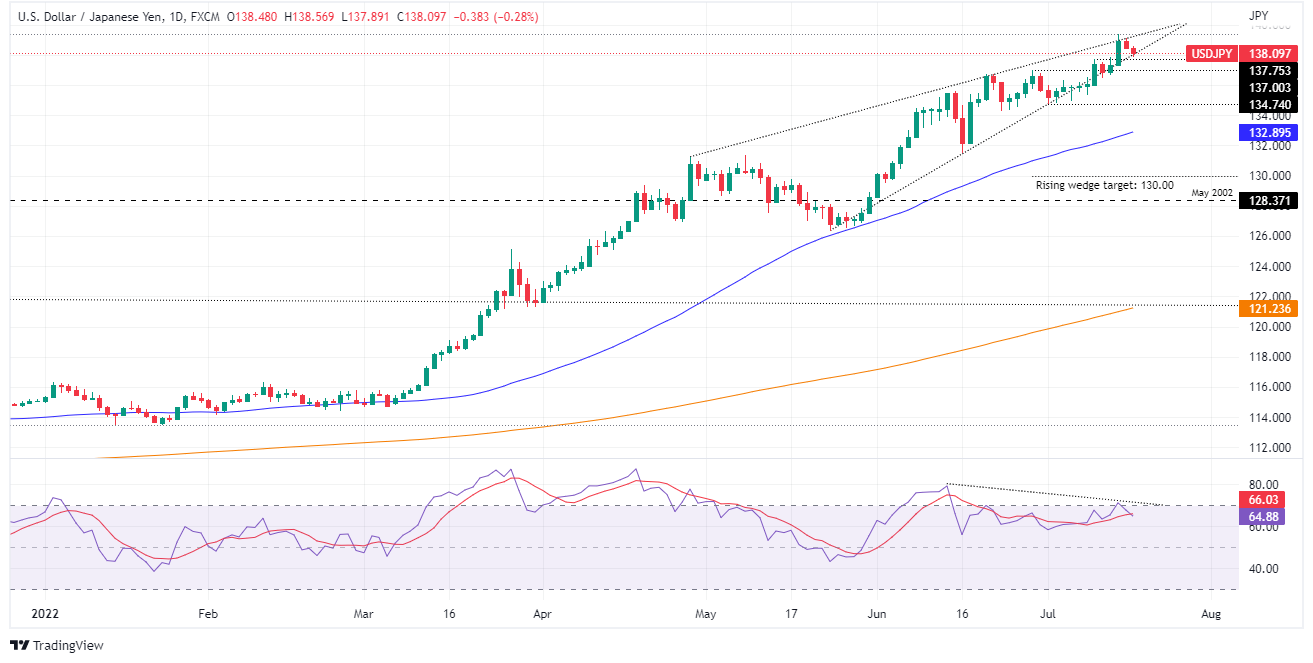
USD/JPY Daily chart
The USD/JPY daily chart depicts the major as upward biased, despite showing signs of losing steam after hitting a 24-year high of around 139.38. Traders should be aware that a rising wedge is still in play and, as portrayed by the price action, stays confined within the top-bottom trendlines of the aforementioned chart pattern, meaning the USD/JPY is about to break in either way.
If the USD/JPY ends upwards, the USD/JPY’s first resistance would be 139.00. A breach of the latter will expose the YTD high at 139.38. Once cleared, the 140.00 mark will be open for a challenge, on the USD/JPY way towards August 1998 high at 147.67.
On the flip side, the USD/JPY first support would be July 11, high at 137.75. Break below will expose the June 29 daily high at 137.00, followed by a test of the July 1 low at 134.74.
USD/JPY Key Technical Levels