WTI Price Analysis: Retains pullback from 100-HMA below $100.00
- WTI crude oil prices pare the biggest daily jump in two months.
- Impending bear cross on MACD, RSI retreats hints at further weakness.
- Adjacent support line tests bears, multiple hurdles stand tall to probe buyers.
WTI crude oil struggles to extend the previous day’s rebound from a three-month low during Friday’s sluggish Asian session. In doing so, the black gold keeps the pullback from the 100-HMA while taking rounds to $99.75 by the press time.
Given the recent RSI retreat from the overbought territory, not to forget the looming bear cross of the MACD line with the signal line, the energy benchmark is expected to stretch the latest pullback.
However, immediate support around $98.70 could serve as a trigger for the commodity’s fresh selling towards the recently marked multi-day low of $93.20.
Following that, March’s low of $92.35 could act as the last defense of bulls before directing the quote to the October 2021 high near $85.00.
On the flip side, recovery remains elusive below the 100-HMA level surrounding $101.75.
Even if the quote crosses the 100-HMA, a convergence of the 200-HMA and 61.8% Fibonacci retracement of the June 29 to July 06 downturn, near $105.00-105.30, could challenge the WTI bulls.
Also likely to test the energy benchmark’s upside momentum is the one-week-old descending resistance line, close to $106.80 by the press time.
WTI: Hourly chart
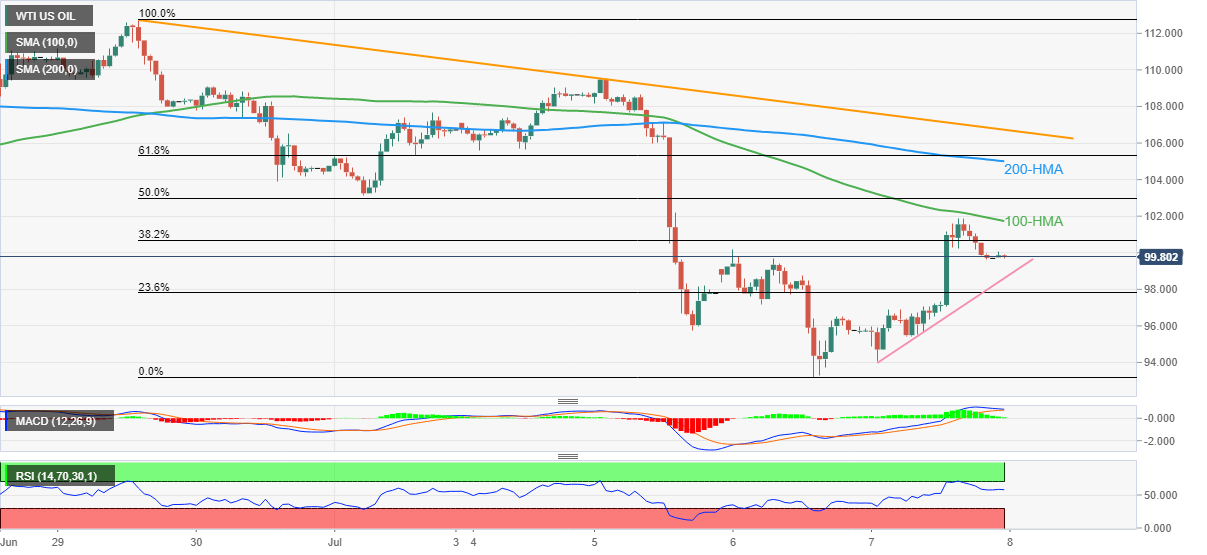
Trend: Further weakness expected