Gold Price Forecast: XAU/USD looks to retest key $1,923 support amid Ukraine woes – Confluence Detector
- Gold price returns to the red, as the US dollar rebounds amid risk-aversion.
- Dwindling Russia-Ukraine peace talks sour mood, in the aftermath of Fed and BOE.
- Gold Price Forecast: XAU/USD bears have the upper hand below $1,960, or 38.2% Fibo.
With the Fed and the BOE policy meetings out of the way, the focus is back on the developments surrounding the Russia-Ukraine conflict. That said, peace talks between both sides are reportedly showing little progress, re-igniting risk-aversion. The US dollar is once again seeing fresh haven demand, which is exerting downward pressure on gold price. Additionally, the renewed upside in oil prices combined with the flattening of the yield curve is alarming markets, benefiting the dollar at gold’s expense.
Read: Zelenskyy Aide Zhovkva: Ukraine-Russia talks are progressing only slowly
Gold Price: Key levels to watch
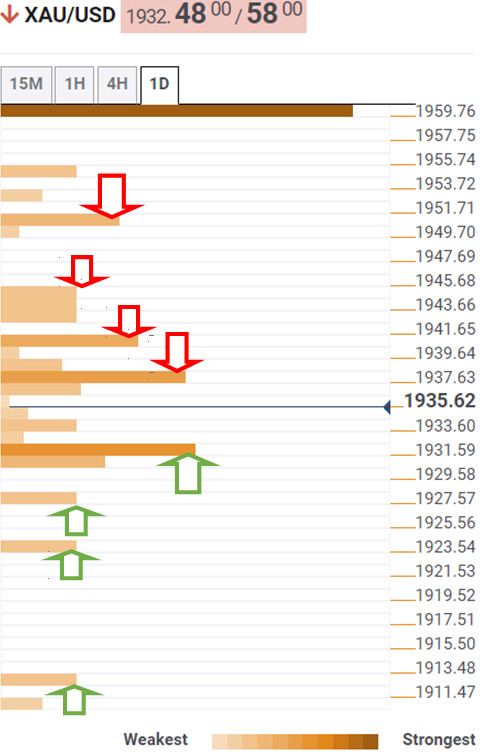
Having tested the $1,950 level, as well predicted here, gold price is now heading south, challenging strong support at $1,929, per the Technical Confluences Detector.
That level is the intersection of the Fibonacci 23.6% one-month and the previous low four-hour.
The next stop for gold bears is seen at $1,926, where the pivot point one-day S1 aligns. Further south, the previous day’s low at $1,923 will be back in focus.
A sustained drop below the latter will fuel a sharp sell-off towards the pivot point one-day S2 at $1,912.
Alternatively, if bulls regain control, then the immediate upside hurdle at $1,937 will be probed. At that level, the pivot point one-week S1 and the previous high four-hour coincide.
The next significant resistance is seen at the Fibonacci 38.2% one-day of $1,940, above which the confluence of the Fibonacci 23.6% one-day and SMA5 one-day at $1,945 will get tested.
Should the renewed upside pick up momentum, gold buyers will then look to threaten the previous day’s high at $1,950.
Here is how it looks on the tool
About Technical Confluences Detector
The TCD (Technical Confluences Detector) is a tool to locate and point out those price levels where there is a congestion of indicators, moving averages, Fibonacci levels, Pivot Points, etc. If you are a short-term trader, you will find entry points for counter-trend strategies and hunt a few points at a time. If you are a medium-to-long-term trader, this tool will allow you to know in advance the price levels where a medium-to-long-term trend may stop and rest, where to unwind positions, or where to increase your position size.