USD/CAD Price Analysis: Retreats from 50% Fibonacci retracement, 1.2530 in focus
- USD/CAD holds onto pullback from six-week high, grinds lower of late.
- RSI nears overbought area, hints at limited upside scope.
- 50-DMA, support line of short-term ascending channel tests bulls.
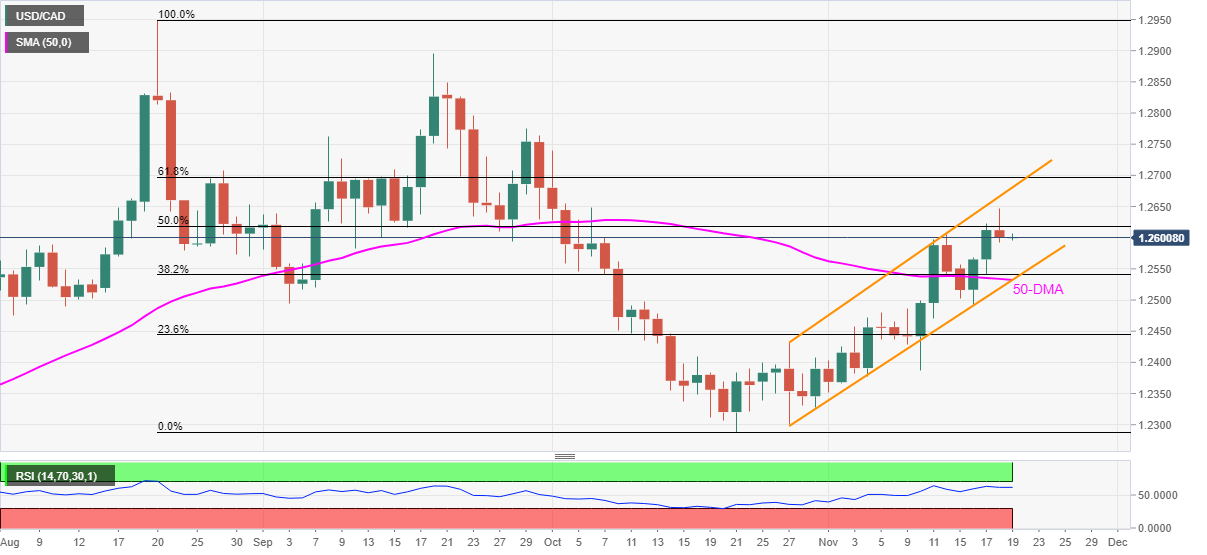
USD/CAD remains depressed around 1.2600, after reversing from early October highs the previous day. With this, the quote stays below 50% Fibonacci retracement (Fibo.) level of August-October fall by the press time of Friday’s Asian session.
Given the limited upside room for the RSI line backing the quote’s latest drop below 50% Fibo. level, the latest downside is likely to extend, at least for the short term.
However, a convergence of the 50-DMA and lower line of the ascending trend channel from October 27 offers a tough nut to crack for the bears around 1.2530.
Should the quote drops below 1.2530, September’s low near 1.2490 and 23.6% Fibonacci retracement level around 1.2445 should return to the charts.
Alternatively, an upside break of the 50% Fibo., at 1.2618, will direct USD/CAD buyers towards the stated channel’s resistance line around 1.2680.
If at all the pair bulls cross the 1.2680 hurdle, the 61.8% Fibonacci retracement close to 1.2700 and 1.2765-70 area comprising multiple levels marked in September will be in the spotlight.
USD/CAD: Daily chart
Trend: Further declines expected