USD/IDR Price News: Rupiah stays firmer towards 200-DMA on upbeat Indonesia Q2 GDP
- USD/IDR fades bounce off seven-week low, takes offs of late.
- Indonesia Q2 GDP rose past QoQ and YoY forecasts, as well as priors.
- Firmer USD, three-month-old support line challenge bears.
- Bearish MACD, upbeat Indonesian updates redirect sellers to the key moving average.
USD/IDR eases to $14,343, down 0.06% intraday, amid early Thursday. In doing so, the Indonesian rupiah (IDR) pair benefits from the Q2 GDP readings amid a sluggish Asian session.
Indonesia's GDP for the second quarter (Q2) rose past 6.57% YOY and 2.94% QoQ market consensus to 7.07% and 3.31% in that order. It’s worth noting that the readings were much better than the previous figures of -0.74% and -0.96% on a quarterly and yearly basis respectively.
While cheering the GDP figures, USD/IDR battles the broad US dollar strength amid covid woes and the Fed tapering concerns.
That said, the US Dollar Index (DXY) remains firmer, backed by upbeat Treasury yields, following its heaviest run-up in a week marked on Wednesday. San Francisco Federal Reserve Bank President Mary Daly follows Fed Vice Chair Richard Clarida and US Treasury Secretary Janet Yellen to renew the tapering chatters.
Also, fears of the Delta variant do firm globally with the multi-day high infections from Australia, China and the US, which in turn offer a tailwind to the US dollar.
Hence, the initial weakness of the pair may have further challenge the risk catalysts that are likely to favor the greenback going forward. However, technical details have something else to say.
Technical analysis
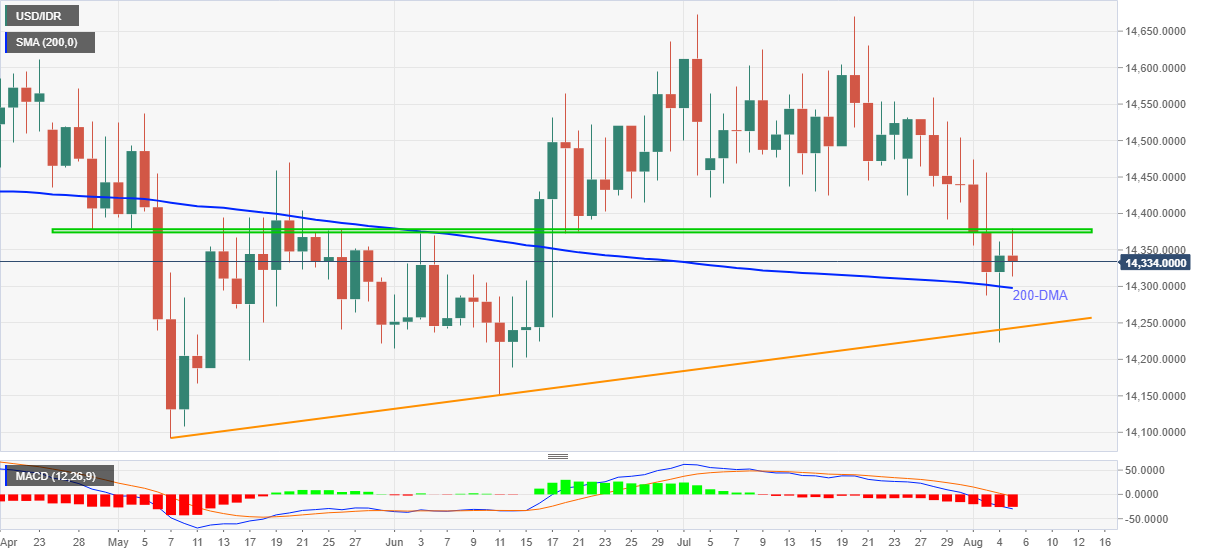
USD/IDR rebound failed to cross a three-month-old horizontal resistance. The pullback moves take clues from the bearish MACD signals to attack the 200-DMA level of $14,297.
However, the pair’s weakness past 200-DMA will be challenged by an ascending support line from early May, near $14,240, a break of which could direct USD/IDR bear to June’s low of $14,151 before highlighting the May month’s bottom surrounding $14,100.
Meanwhile, daily closing above $14,380 will aim for $14,420-25 area including multiple lows marked during June–July.
Should USD/IDR bulls manage to keep the reins past $14,425, the $14,550 level will gain the market’s attention ahead of July’s double tops near $14,670.
Overall, USD/IDR remains bearish but intermediate consolidation can’t be ruled out.
USD/IDR: Daily chart
Trend: Bearish