GBP/USD Price Analysis: Rebound appears capped near 1.3900
- GBP/USD attempts a bounce but the bearish bias remains intact.
- The cable confirms a descending triangle breakdown on the 4H chart.
- Bulls need to crack this key resistance near 1.3900 to reverse the downtrend.
GBP/USD is making a minor recovery attempt from daily lows of 1.3859, as the US dollar stalls its advance amid improving market mood.
A minor pullback in the US Treasury yields is also helping the rebound in the cable, although the risks continue to remain skewed to the downside.
This view holds true as the currency pair confirmed a descending triangle breakdown on the four-hour chart earlier in the Asian trades, having closed the candle below the horizontal trendline support at 1.3871.
Immediate support for the pair appears at the 1.3850 psychological level, below which the June 21 low of 1.3787 could be challenged.
The Relative Strength Index (RSI) has inched higher but still remains below the 50.00 level, suggesting that the bears will continue to hold their grip on the major.
A 21 and 50-Simple Moving Averages’ (SMA) bear cross also backs the downbeat price outlook.
GBP/USD four-hour chart
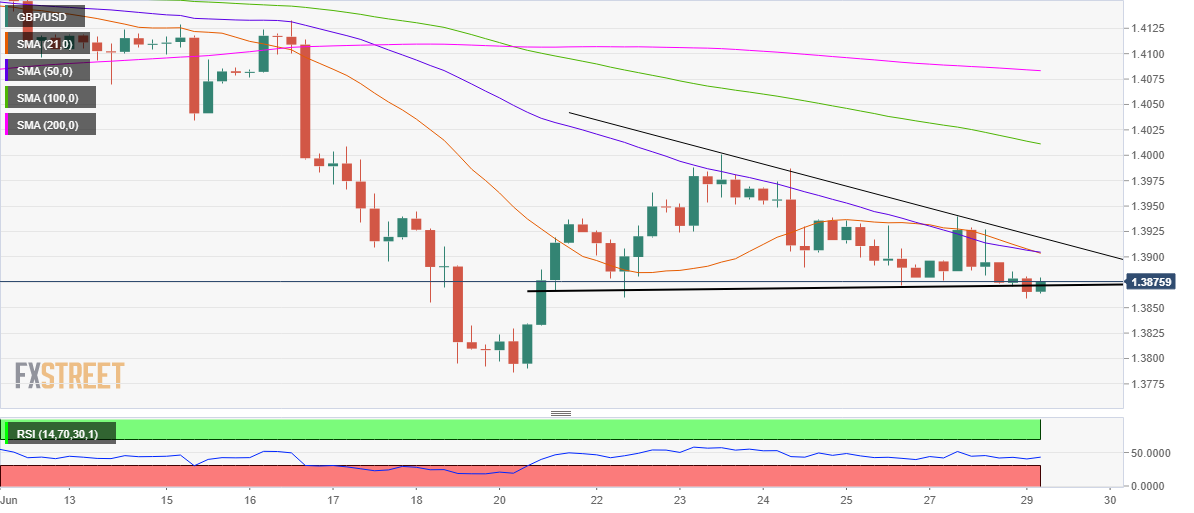
For the recovery to sustain in the near term, the price needs to recapture the 1.3903 hurdle, which is the confluence of the 21 and 50-SMAs.
Further up, the triangle resistance at 1.3919 will be on the buyers’ radars.
GBP/USD additional levels to watch