USD/INR Price News: Inverse H&S keeps Indian rupee sellers hopeful near 73.00
- USD/INR snaps two-day upbeat inside a bullish chart pattern.
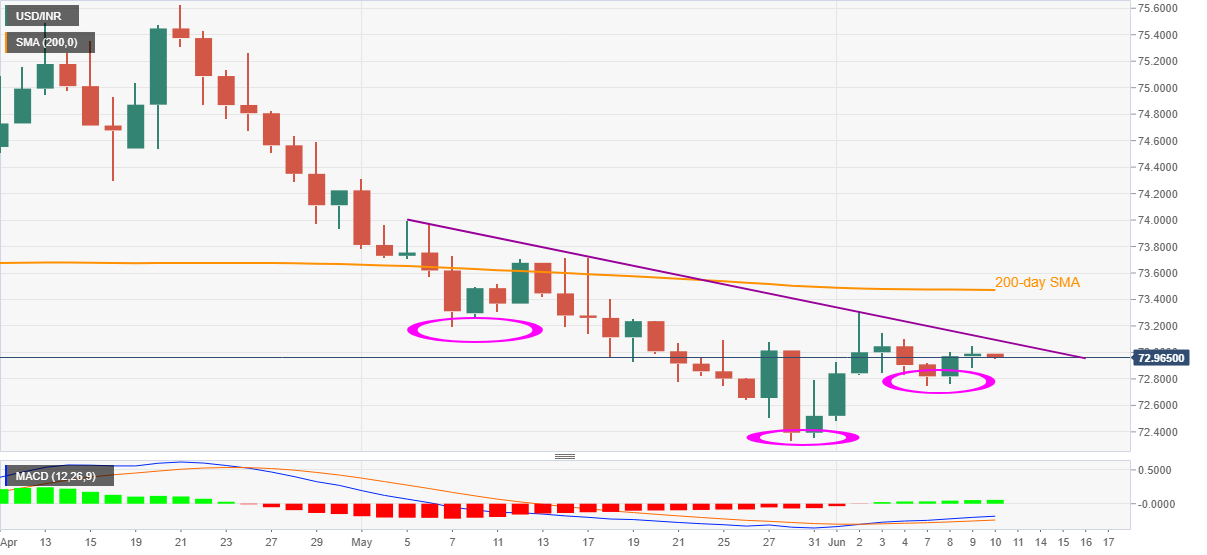
- Upbeat MACD signals back buyers but 200-day SMA adds to the upside filters.
USD/INR refreshes intraday low to 72.95, down 0.05%, amid Thursday’s early Indian session. In doing the quote portrays the market’s anxiety ahead of the key US Consumer Price Index (CPI) data to drop for the first time in three days.
Read: US CPI May Preview: Inflation angst is coming
Even so, bullish cross-over the MACD lines join the up gradually increasing histogram teases the Indian rupee (INR) sellers inside an inverse head-and-shoulders (H&S) chart pattern on the daily play.
While a clear break above 73.10 necklines confirms the USD/INR theoretical run-up towards the 75.00 levels, 200-day SMA near 73.50 and May 05 top near the 74.00 threshold offer intermediate checks to the prices.
On the contrary, pullback moves below the weekly bottom of 72.74 defy the bullish chart pattern, which in turn can direct the USD/INR prices to the previous month’s low near 72.33.
Overall, USD/INR bears seem to have tired of late and a confirmation of the inverse H&S could set the tone for a trend change.
USD/INR daily chart
Trend: Further recovery expected