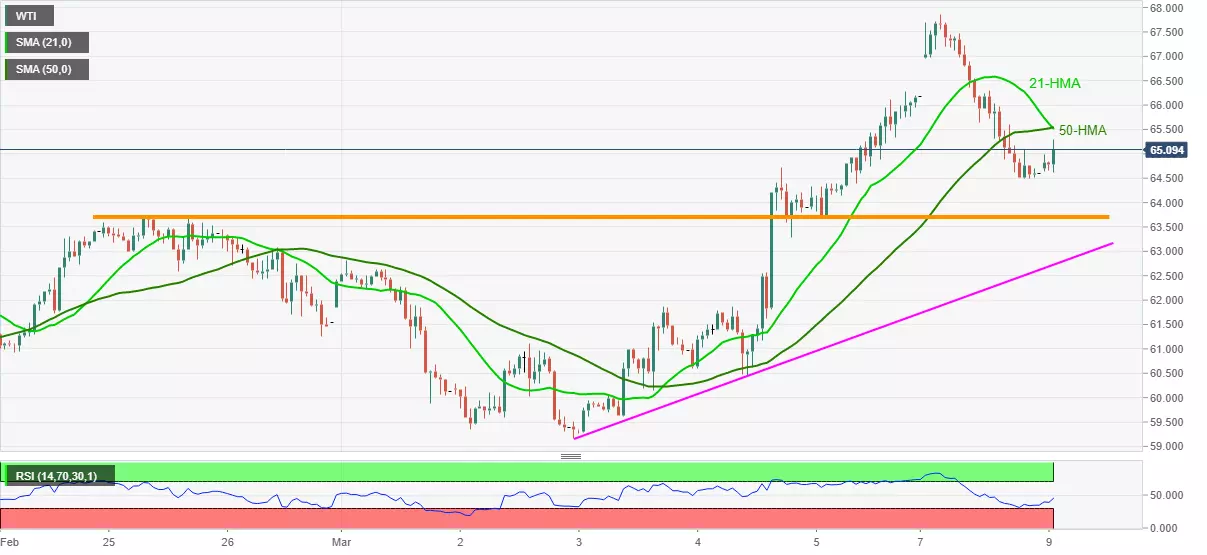
WTI Price Analysis: Immediate HMA confluence tests recovery moves around $65.50
- WTI bounces off intraday low while trying to recover the previous day’s losses.
- 21-HMA, 50-HMA guards nearby upside, two-week-old horizontal support will challenge sellers.
WTI holds $65.00, currently up 0.80% around $65.10, during early Tuesday. In doing so, the energy benchmark recovers from the intraday low while trying to trim Monday’s pullback moves from a multi-month high.
Although RSI’s U-turn from the oversold area, coupled with upbeat fundamentals, favor WTI bulls, a confluence of 21 and 50-HMA around $65.50-55 probes immediate upside of the black gold.
Also acting as a short-term resistance will be the $66.30, a break of which may not hesitate to refresh the highest levels marked since October 2018 while eyeing the $68.00 threshold.
Meanwhile, a horizontal area comprising February 25 highs and last Thursday’s lows around $63.80-65 can offer nearby support during the quote’s fresh declines.
Even if WTI sellers break strong horizontal support, a one-week-old ascending support line around $62.70 should challenge further downside ahead of highlighting the $60.00 psychological magnet for sellers.
WTI hourly chart

Trend: Bullish
