AUD/NZD Price Analysis: Buyers lurk around 50-bar EMA
- AUD/NZD prints three-day losing streak while extending losses from 23-month top.
- Bearish MACD suggests further weakness but the key supports challenge the moves.
- The 1.1000 threshold offers immediate upside barrier during fresh run-up.
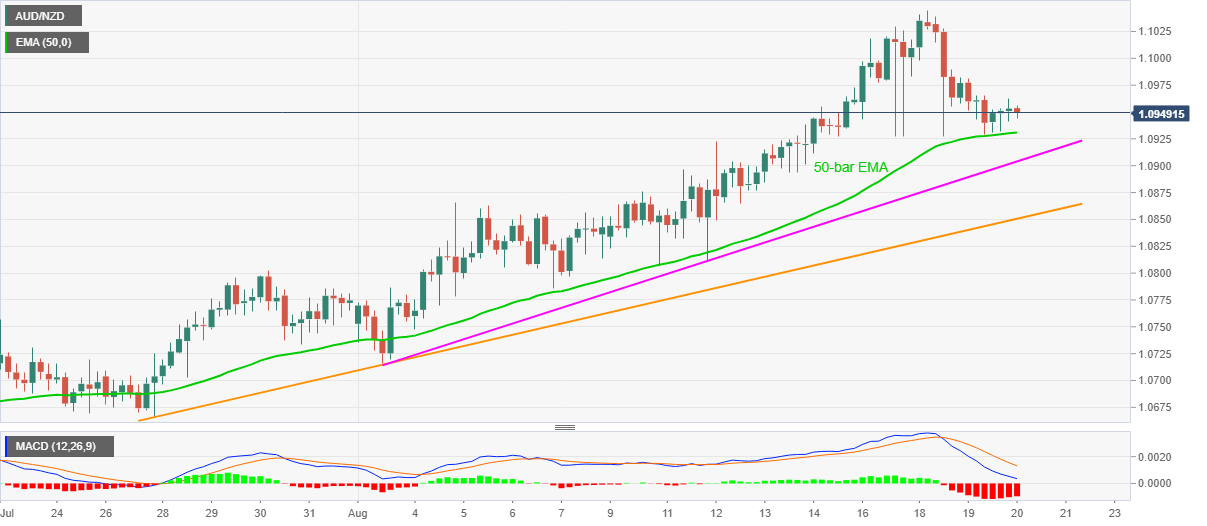
AUD/NZD stays depressed around 1.0950 during the initial hour of Tokyo open on Thursday. The pair reversed from September 2018 top early in the week but 50-bar EMA recently challenged the downside. However, bearish MACD signals further weakness of the quote towards the key trend line support.
Hence, fresh selling can be expected on the break AUD/NZD price break below the 50-day EMA level of 1.0930, which in turn highlights an ascending trend line from August 03, at 1.0900.
However, the pair’s downside past-1.0900 will be challenged by a rising support line from July 27, at 1.0850, which if broken will recall a July-end top near 1.0800 on the chart.
Alternatively, 1.1000 mark guards the pair’s immediate upside ahead of the multi-week top near 1.1050 and September 2018 top surrounding 1.1065-70.
During the quote’s sustained rise past-1.1070, the yearly 2018 peak surrounding 1.1190 will be in the spotlight.
AUD/NZD four-hour chart
Trend: Further weakness expected