AUD/USD Price Analysis: Recovery from down under? Not so fast – Confluence Detector
AUD/USD has been on the back foot amid the risk-off mood stemming from rising US coronavirus deaths, Melbourne's lockdown, and other factors. Can the Aussie recover? The technical positioning is not promising for the bulls.
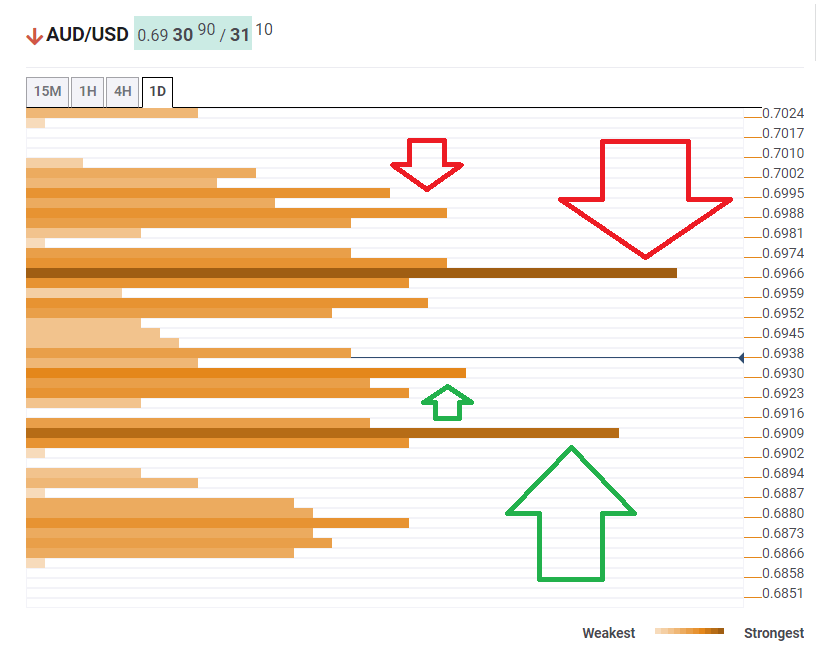
The Technical Confluences Indicator is showing that Aussie/USD faces resistance at 0.6966, which is the convergence of the Simple Moving Average 100-1h, the SMA 200-15m, the SMA 50-1h, and the Fibonacci 23.6% one-month.
The next target is 0.6988, which is the meeting point of the Pivot Point one-week Resistance 1 and the Bollinger Band one-day Upper.
Immediate support is at 0.6930, which is the confluence of the BB 4h-Lower, the SMA 10-one-day, and the Fibonacci 23.6% one-week.
Strong support is at 0.6909, which is where the Fibonacci 38.2% one-month, the Fibonacci 38.2% one-week, and the SMA 100-4h converge.
Here is how it looks on the tool:
Confluence Detector
The Confluence Detector finds exciting opportunities using Technical Confluences. The TC is a tool to locate and point out those price levels where there is a congestion of indicators, moving averages, Fibonacci levels, Pivot Points, etc. Knowing where these congestion points are located is very useful for the trader, and can be used as a basis for different strategies.
This tool assigns a certain amount of “weight” to each indicator, and this “weight” can influence adjacents price levels. These weightings mean that one price level without any indicator or moving average but under the influence of two “strongly weighted” levels accumulate more resistance than their neighbors. In these cases, the tool signals resistance in apparently empty areas.
Learn more about Technical Confluence