USD/CAD Price Analysis: Bears cheer break of key support below 1.3600
- USD/CAD drops to three-month low, under 61.8% Fibonacci retracement.
- 200-day SMA, February month’s high on the sellers’ radar.
- Buyers will refrain entries unless regaining the 1.3730/35 support-turned-resistance.
USD/CAD extends the previous day’s heavy fall to 1.3553, down 0.13% on a day, amid the initial Asian session on Tuesday. In addition to the pair’s declines below 100-day SMA and an ascending trend line from the early-March, sustain trading below 61.8% Fibonacci retracement of December 2019 to March 2020 upside also portrays the bears’ dominance.
With that in the backdrop, sellers are targeting a confluence of 200-day SMA and February month high, around 1.3465/60 during the further downside.
However, the quote’s additional weakness under 1.3460 makes it vulnerable to visit February 10 high near 1.3330.
Alternatively, a daily closing beyond 61.8% Fibonacci retracement near 1.3610 could trigger the pair’s fresh recovery towards the support-turned-resistance area of 1.3730/35.
Even so, 50% Fibonacci retracement and April month’s low, respectively around 1.3810 and 1.3850, could keep the tab on buyers.
USD/CAD daily chart
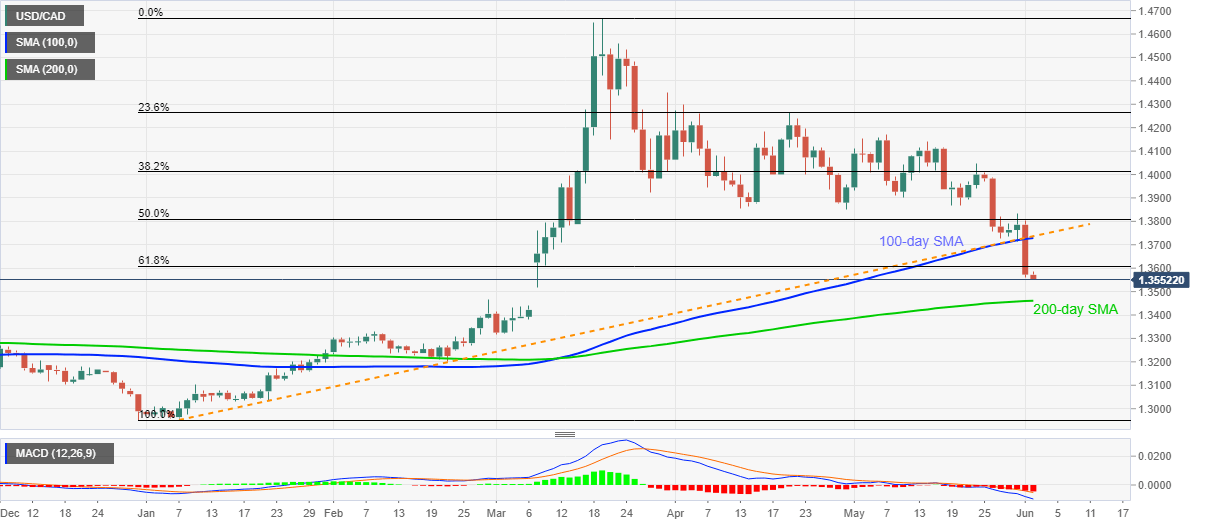
Trend: Bearish