USD/IDR Price Analysis: On the back foot but still above key supports
- USD/IDR struggles for firm direction after pulling from the record high.
- 10-day SMA, monthly support line restrict immediate downside.
- Buyers will look for entry beyond 17,155 for fresh entry.
Following its U-turn from the record top during the early-week, USD/IDR takes rounds to 16,570 amid the pre-Europe session on Friday.
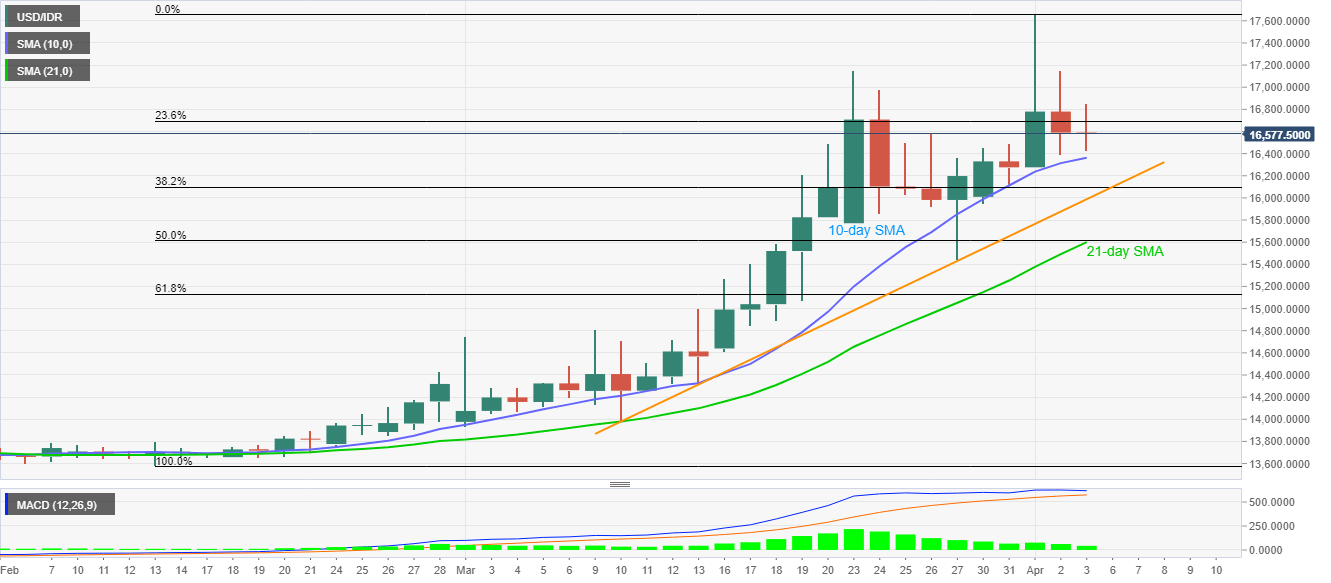
Although the pullback dragged the quote below 23.6% Fibonacci retracement of its February-March upside, the quote is still above its near-term key supports, namely a 10-day SMA level of 16,360, an ascending trend line from March 10 near 15,990 and 21-day SMA around 15,600.
Not only the pair’s trading beyond important supports but bullish MACD also keeps buyers hopeful.
Even so, fresh buying interests are likely to be witnessed above 17,150/55 area including highs marked on March 23 and April 02.
Following that, the recent record high near 17,760 could offer an intermediate halt before pushing the bulls to 18,000 mark.
USD/IDR daily chart
Trend: Bullish