Back


27 Mar 2020
US Dollar Index Price Analysis: DXY records its largest weekly decline since 1986
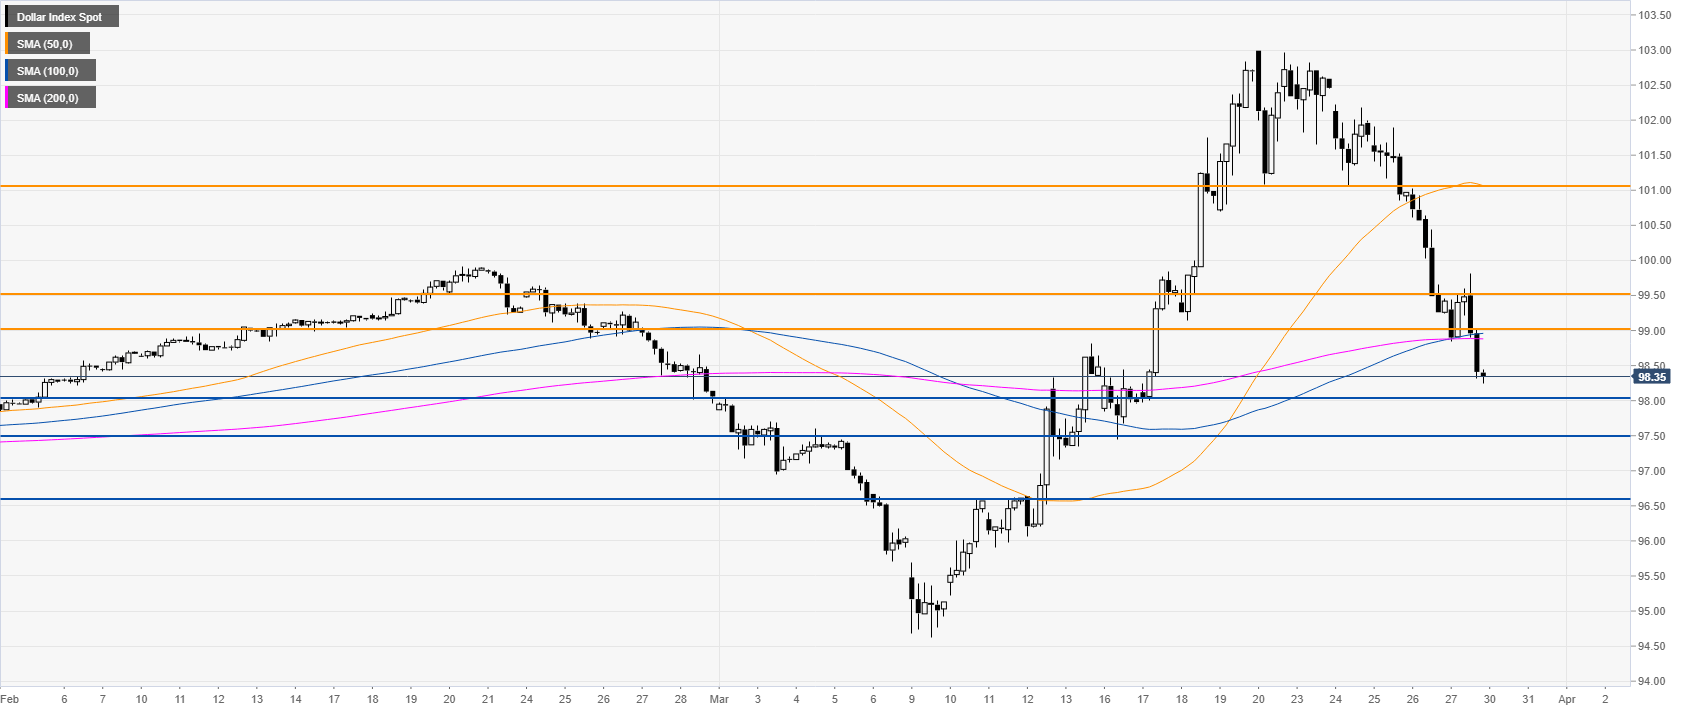
- US dollar index (DXY) broke below the 99.00 figure and the 100/200 SMA on the four-hour chart.
- The level to beat for bears is the 98.00 support.
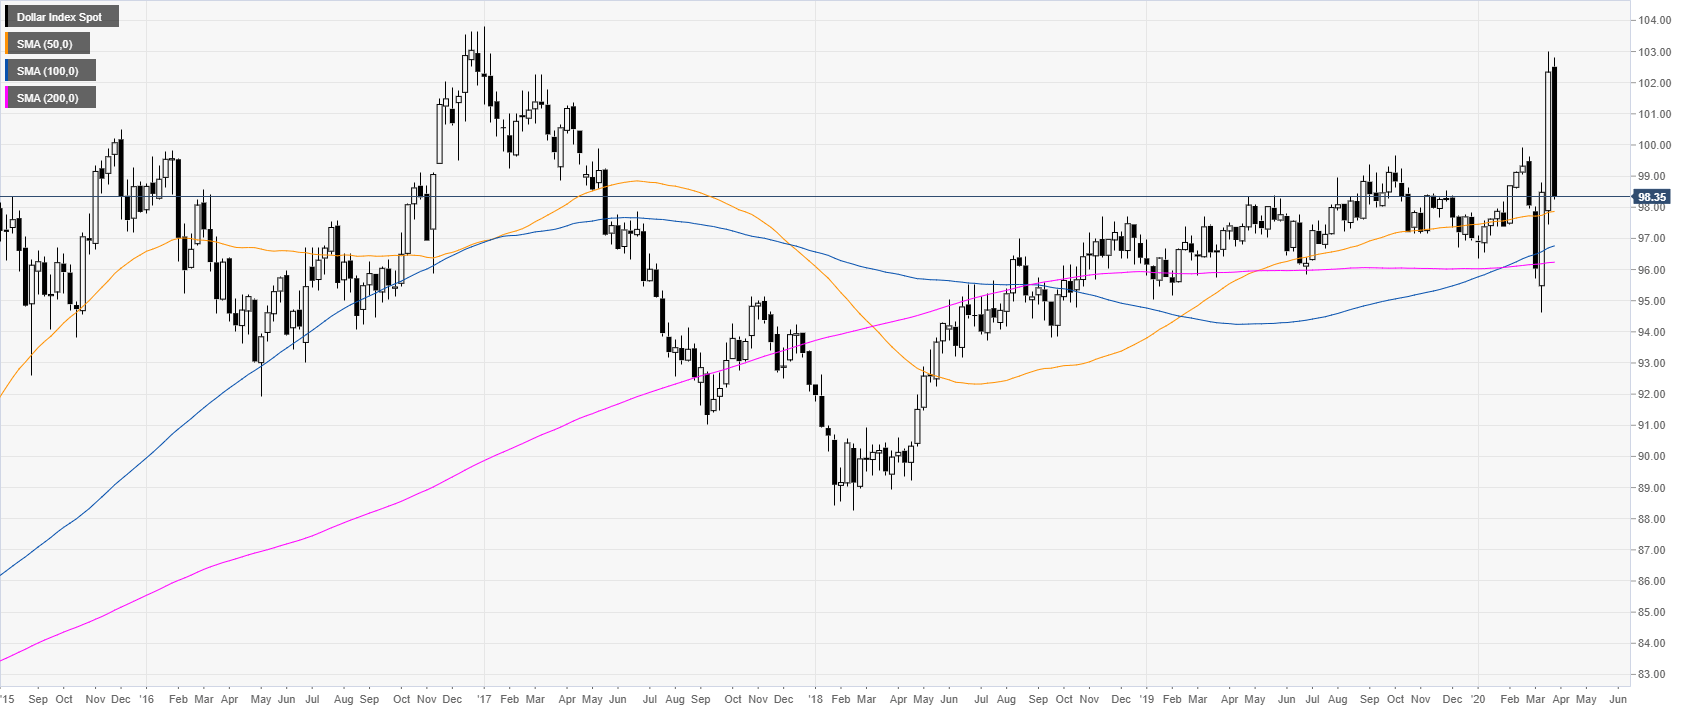
DXY weekly chart chart
DXY had its worst weekly decline since April 1986 as the bearish pressure has been relentless throughout the week.

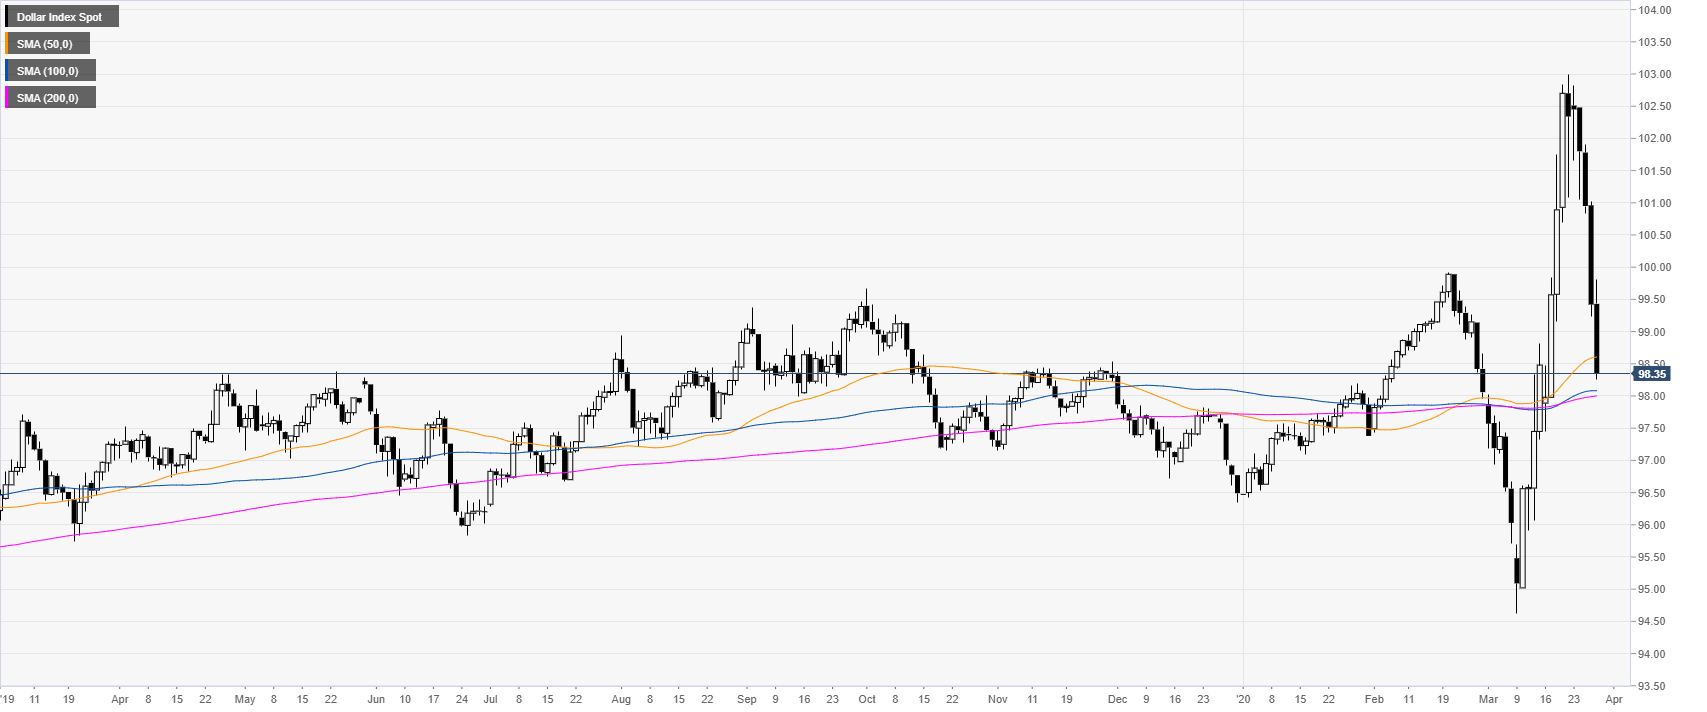
DXY daily chart
The greenback is nearing its daily 100 and 200 SMAs near the 98.00 figure. It is likely that next week DXY will challenge the above-mentioned level.

DXY four-hour chart
After an attempted bounce near the 99.00 figure near the 100/200 SMAs on the four chart, DXY broke below and reached a low of 98.25 this Friday. As the bears are in control, DXY is set to extend losses towards the 98.00, 97.00 and 96.60 levels in the medium term.

Additional key levels
