Back

23 Mar 2020
USD/CAD Price Analysis: US dollar clings to 4-year's highs, near 1.4500 figure vs. CAD
- USD/CAD is trading to levels last seen in January 2016.
- The level to beat for bulls is the 1.4674 resistance.
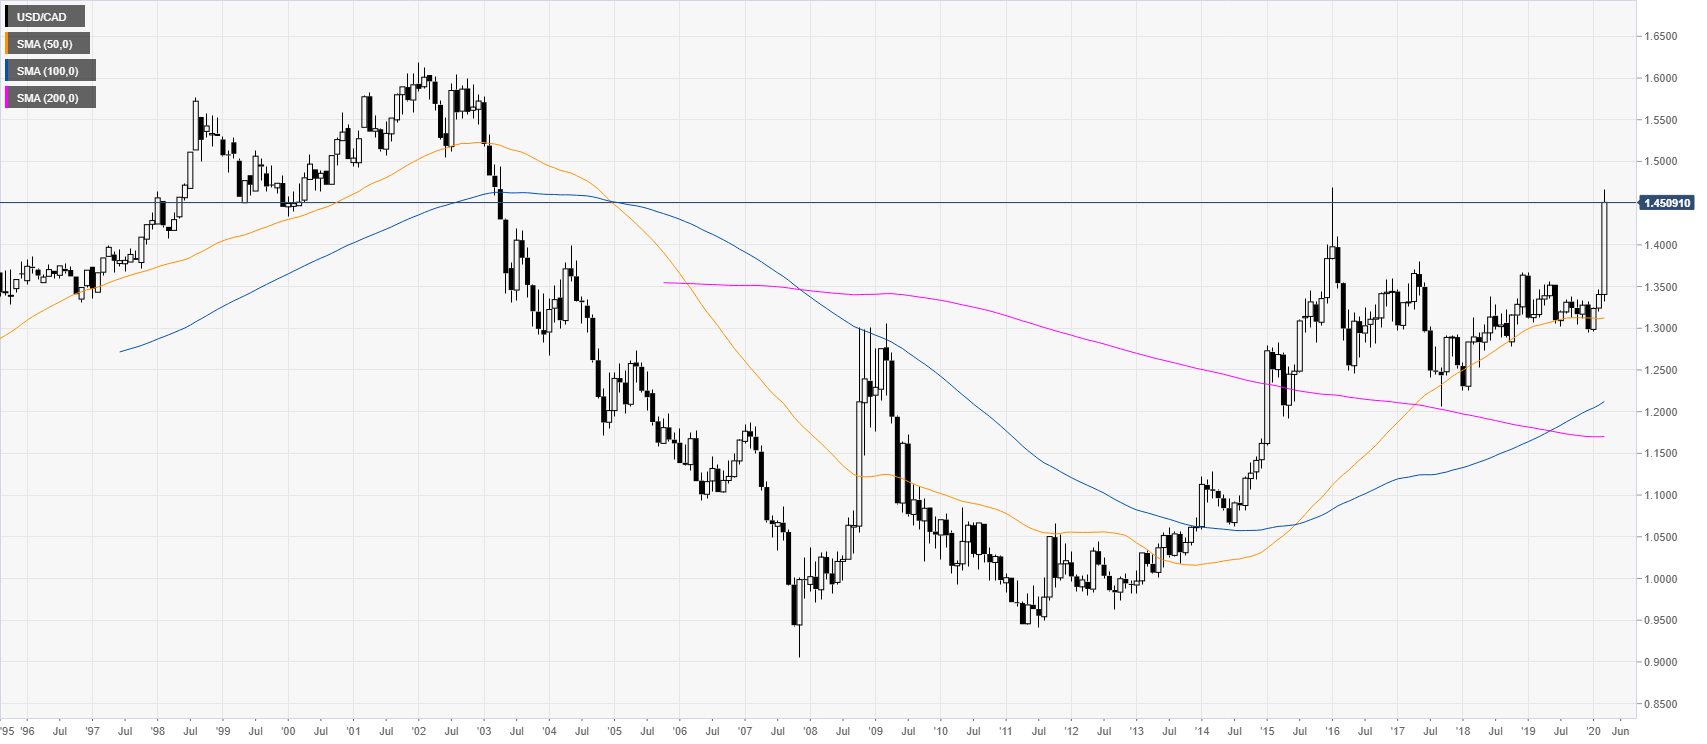
USD/CAD monthly chart
USD/CAD trading near levels not seen since January 2016 as the spot trades near the 1.4500 figure. The oil debacle is driving the Canadian dollar down and USD/CAD up. Moreover, broad-based USD demand is keeping the currency pair near 4-year highs.
USD/CAD four-hour chart
USD/CAD is forming the largest spike in the last five years as bulls keep the buying pressure unabated. A break above the 1.4674 resistance can lead to further gains towards the 1.4800 and 1.5000 levels. However, in the medium term, it would be worthwhile to keep an eye on oil prices as 1.4674 could be strong resistance. Support is seen near the 1.4462, 1.4300 and 1.4200 price levels.
Resistance: 1.4674, 1.4800, 1.500
Support: 1.4462, 1.4300, 1.4200
Additional key levels