USD/INR Price Analysis: Monthly support trendline, 21/50-day SMAs question sellers
- USD/INR for the second day in a row.
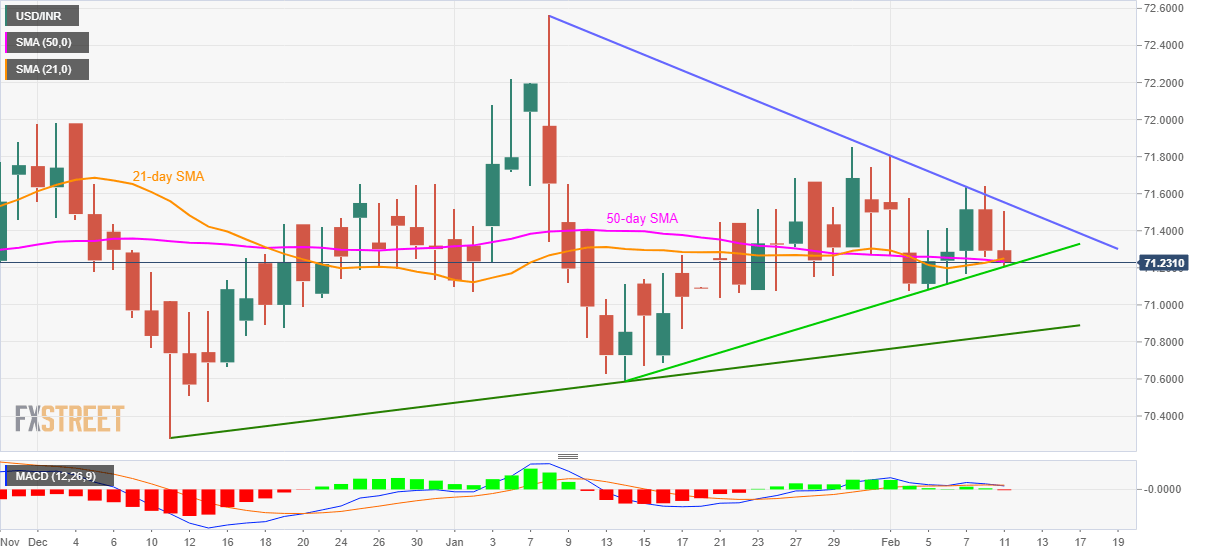
- 21-day and 50-day SMAs add strength to the support.
- Monthly falling trend line guards immediate upside.
USD/INR drops 0.10% during the initial hours of the Indian market’s open to 71.23. With that, the pair extends the previous day’s declines while 21/50-day SMAs and a rising trend line since January 14 limits immediate declines.
Considering the strength of the support, coupled with bullish MACD, USD/INR prices may bounce back towards challenging the five-week-old descending trend line around 71.55.
However, the pair’s upside beyond 71.55 will be decisive in fueling it towards 72.00, with January 30 top near 71.85 acting as an intermediate halt during the rise.
If at all the quote slips below 71.25/20 support confluence on a daily closing basis, 71.00 could act as a buffer while targeting an upward sloping trend line since December 11, 2019, currently at 70.83.
It’s worth mentioning that the yearly bottom near 70.59 and December 2019 low close to 70.28 can entertain the bears ahead of 70.00 if they dominate past-70.83.
USD/INR daily chart
Trend: Pullback expected
FXStreet Indonesian Site - new domain!
Access it at www.fxstreet-id.com