Back
10 Feb 2020
US Dollar Index Price Analysis: DXY keeps grinding to the upside as bulls eye the 99.00 figure
- DXY is up for the sixth consecutive day, trading at its highest since October 2019.
- Upside targets can be located near the 99.00 figure and 99.40 price level.
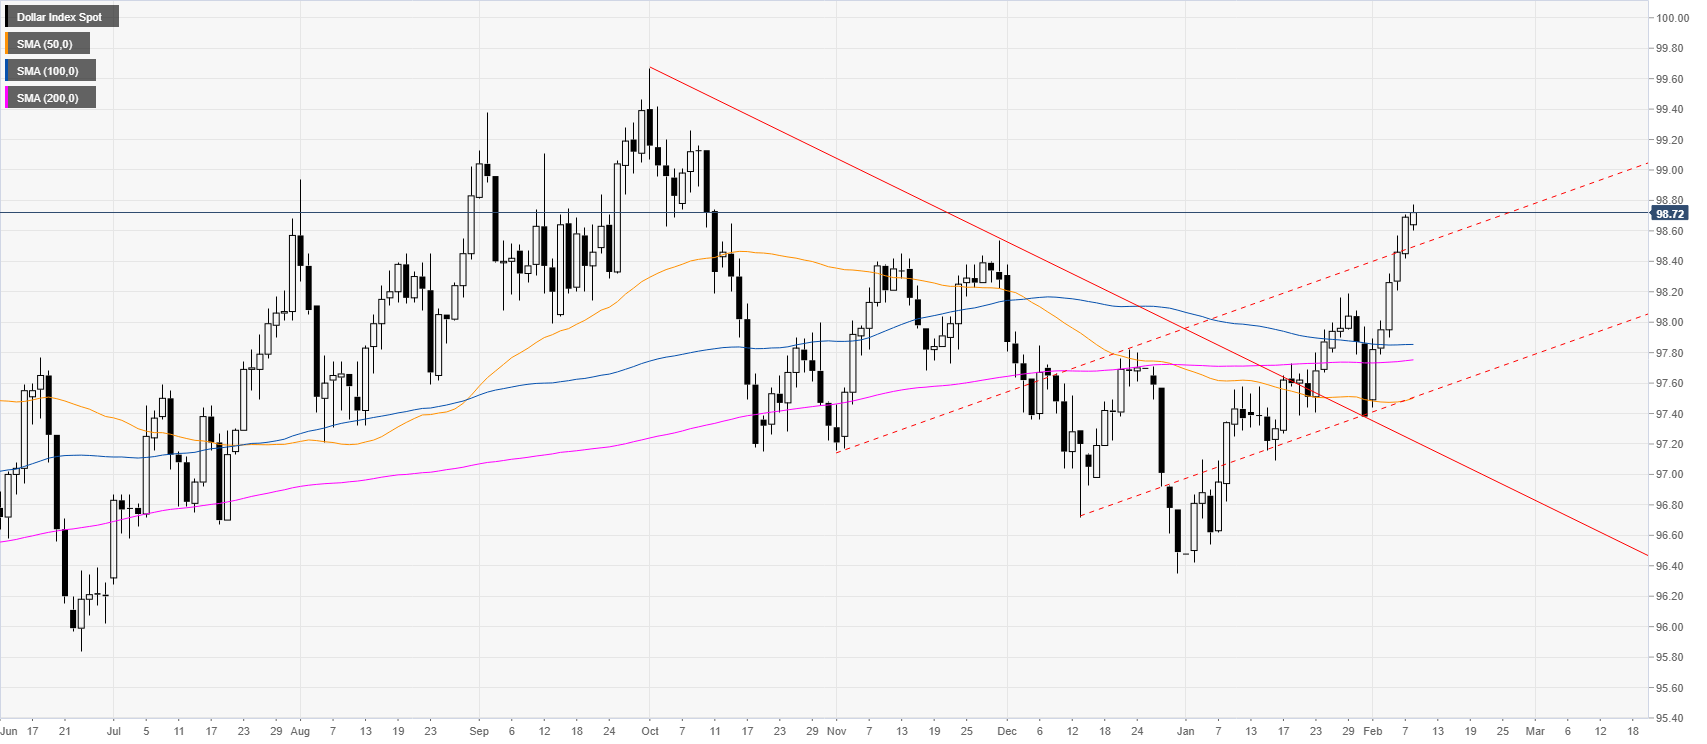
DXY daily chart
The US dollar index (DXY) is trading at its highest since mid-October while trading above the main simple moving averages (SMAs).
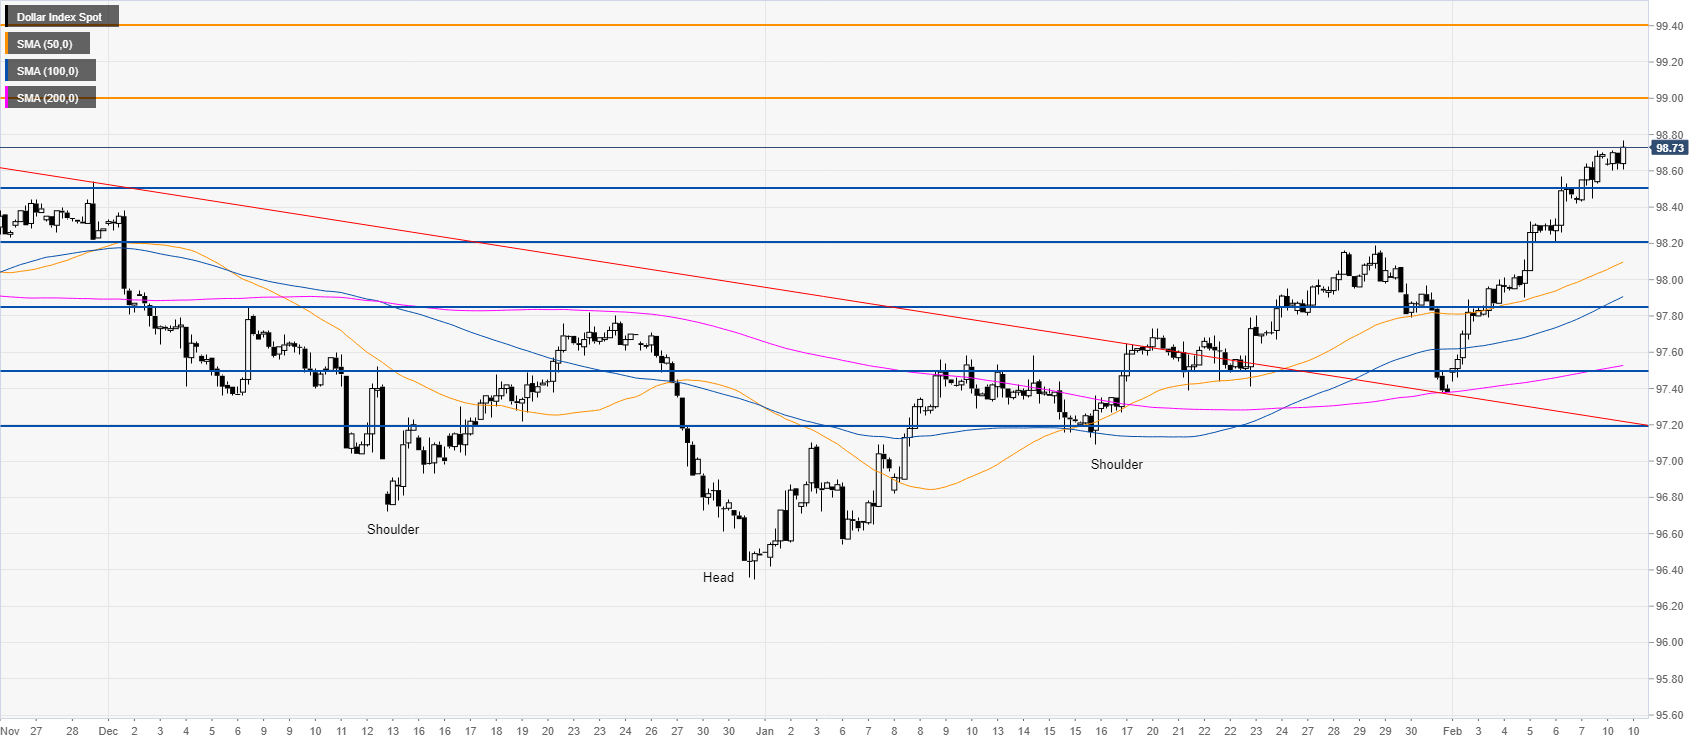
DXY four-hour chart
DXY is spiking to the upside in a tight bull channel. As the buyers are in control the index might continue to climb towards the 99.00 figure and possibly to the 99.40 level if DXY gathers enough momentum. Support could emerge near the 98.50 and 98.20 price levels.
Additional key levels