Gold Price Analysis: Portrays rising trend-channel on H4
- Gold fails to cross intermediate Fibonacci resistance while keeping eight-day-old bullish technical formation.
- January 14 lows will please sellers during the channel’s breakdown, 23.6% Fibonacci retracement can challenge buyers alternatively.
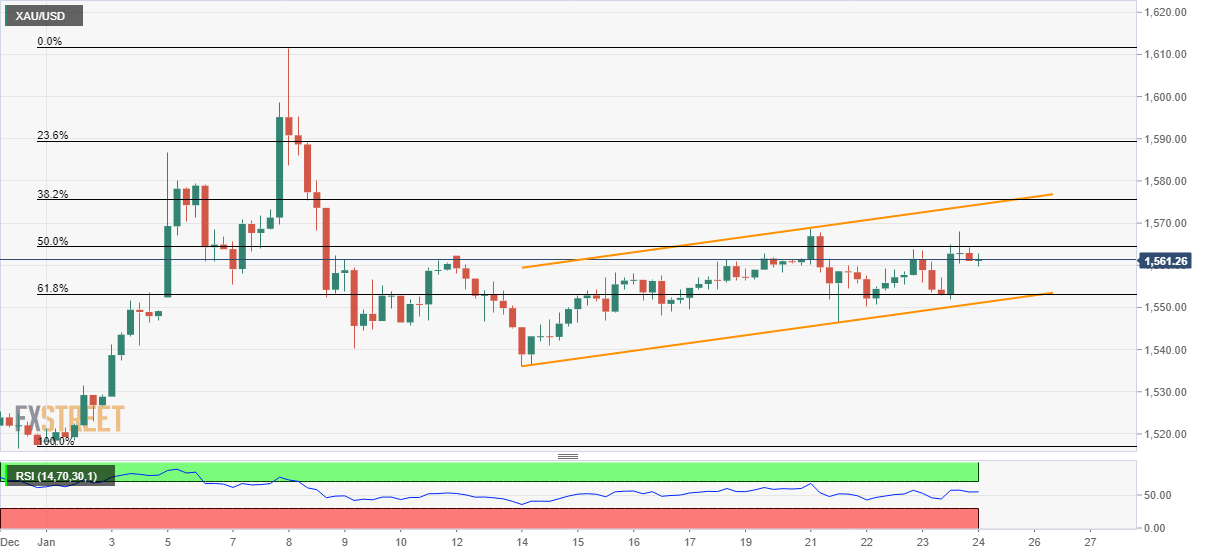
Gold prices lack momentum while trading around $1,561.50 during early Friday. Even so, the bullion stays inside a short-term ascending trend-channel formation that portrays the strength of the underlying momentum.
With this, buyers can take aim at the formation resistance surrounding $1,574.50 if managed to break 50% Fibonacci retracement of the early-month upside, at $1,564.50.
In a case where the bulls dominate past-$1,575, 23.6% Fibonacci retracement level of $1,590 can offer an intermediate halt during the run-up to $1,600 and then to the monthly high near $1,612.
On the downside, 61.8% Fibonacci retracement and the channel’s support line will question the sellers close to $1,553 and $1,551. Also nearing will be $1,550 round-figure.
Given the bears’ ability to rule below $1,550, the current month’s low of $1,536 and $1,530 could flash on their radars while $1,517 could grab the spotlight afterward.
Gold four-hour chart
Trend: Further recovery expected