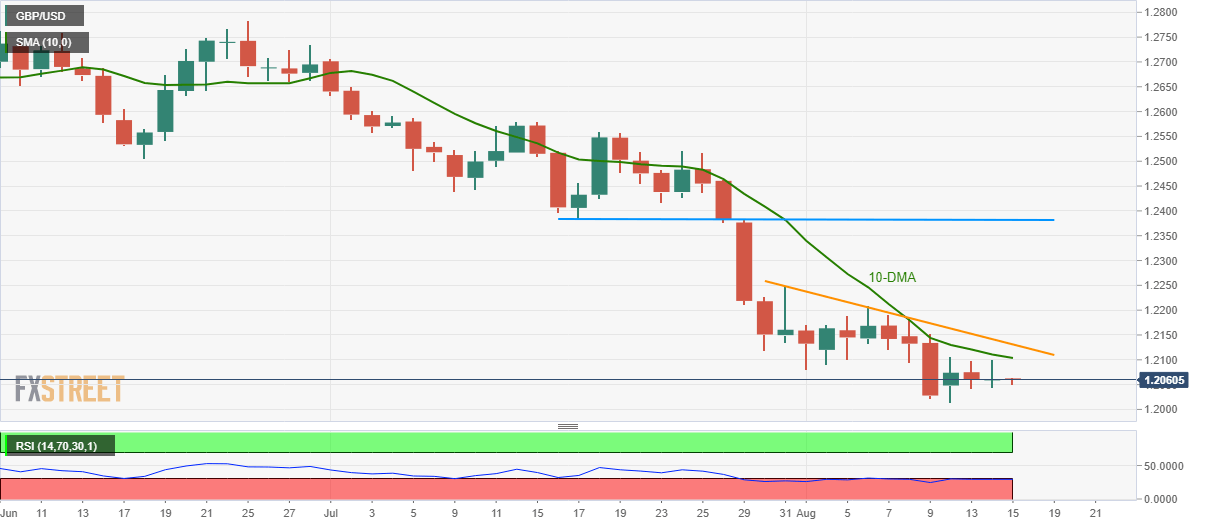
GBP/USD technical analysis: Heavy below 10-DMA, 2-week old resistance-line
- Wednesday’s Doji-like candle on daily chart can’t portray GBP/USD strength unless breaking near-term key resistances.
- Oversold RSI increases the odds for a pullback.
Despite forming similar to the ‘Doji’ candle on a daily chart, GBP/USD lags behind immediate upside barriers while taking rounds to 1.2060 during early Thursday.
The ‘Doji’ formation generally reverses the trend and is more influential when prices are low, as in the case of the Cable. Also supporting the recovery is oversold conditions of 14-bar relative strength index (RSI). Though, 10-day simple moving average (DMA) and a downward sloping trend-line since July 31 can keep the recovery in check around 1.2104 and 1.2131 respectively.
Should buyers successfully dominate beyond 1.2131, July 21 high near 1.2250 holds the key to the pair’s rise to 1.2382/84 horizontal-area comprising extremes of July 17 and 29.
Alternatively, 1.2015, 1.2000 and the 2017 low near 1.1987 could keep sellers busy ahead of pushing them towards 2016 low around 1.1806.
GBP/USD daily chart

Trend: Bearish
