Back
21 Feb 2019
Gold Technical Analysis: Pullback to ascending 5-day MA likely
Gold is currently trading at $1,340, having clocked a high of $1,346.85 yesterday.
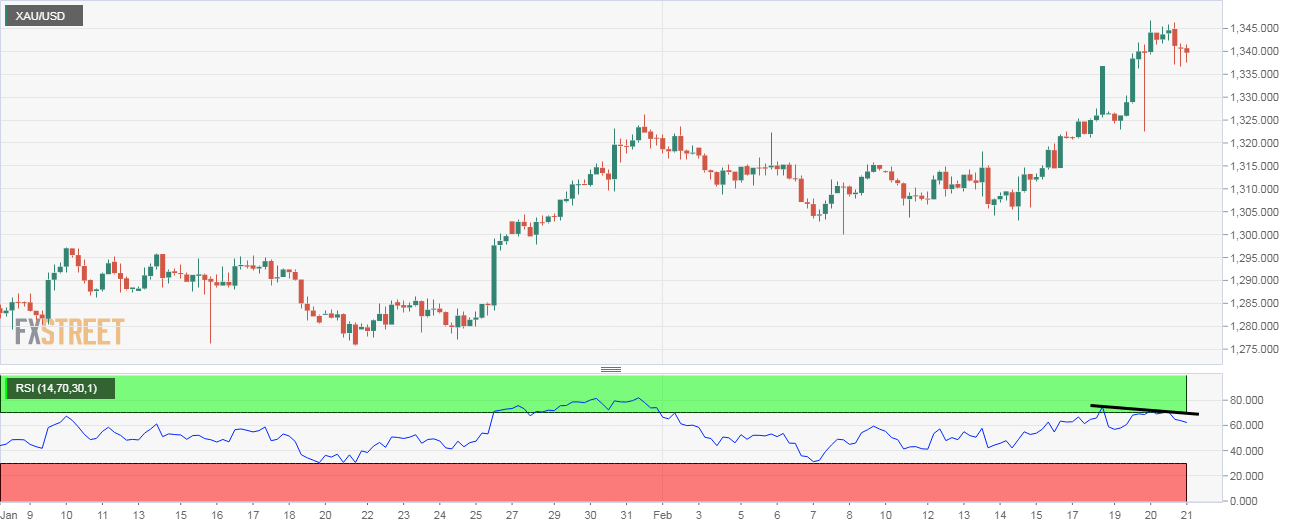
On the daily chart, the safe haven yellow metal carved out a doji candle yesterday, signaling indecision/bullish exhaustion. Further, on the 4-hour chart, the RSI has diverged in favor of the bears.
Therefore, the yellow metal could fall back to the ascending 5-day moving average (MA) support, currently lined up $1,335.
Daily chart
-636863164225059774.png)
4-hour chart
Trend: Minor correction likely