Back
18 Feb 2019
AUD/USD Technical Analysis: 0.7165-0.7170 guards the upside to 0.7200
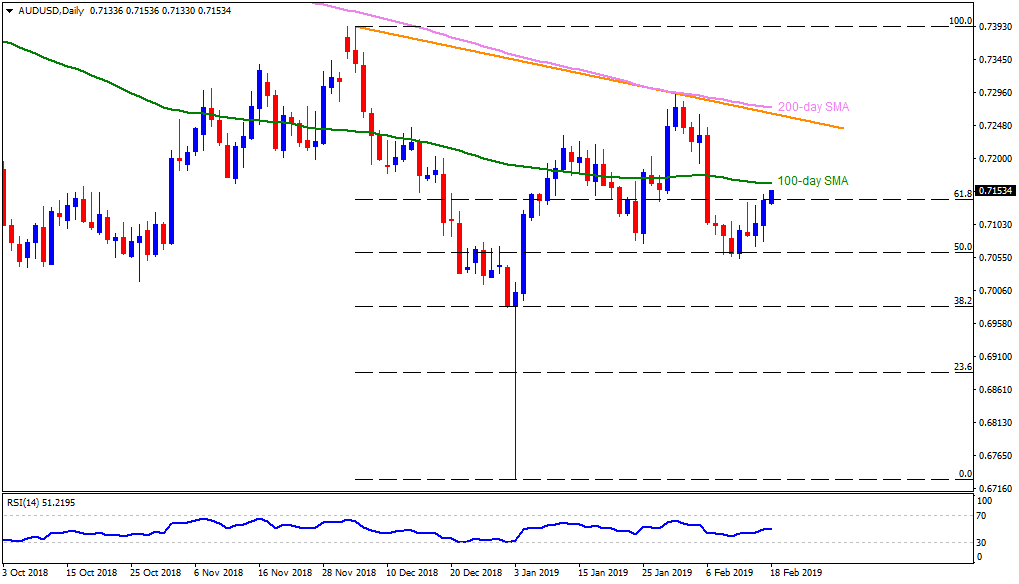
AUD/USD daily chart
- The Australian Dollar (AUD) is currently trading at the highest levels against the USD since February 06 on early Monday.
- The 100-day simple moving average (SMA), at 0.7165, seems immediate resistance, a break of which can escalate the recovery to 0.7200 and 0.7230 numbers to the north.
- Further, a descending trend-line stretched since early December and 200-day SMA can limit the pair’s upside past-0.7230 around 0.7265 and 0.7275 respectively.
- Alternatively, 0.7115 and 0.7070 can act as adjacent supports for the pair ahead of highlighting 0.7040, 0.7015 and 0.7000 consecutive rest-points.
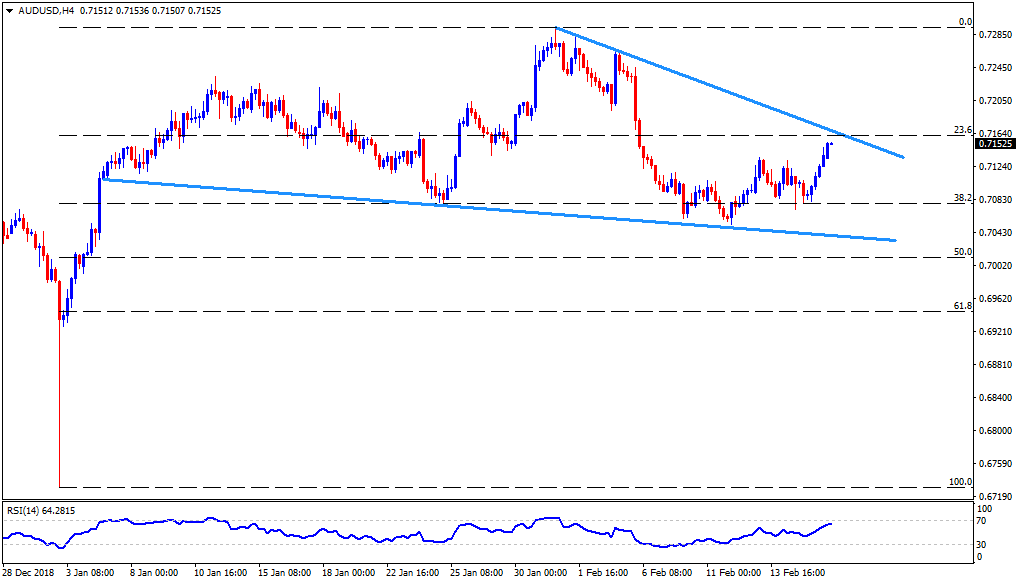
AUD/USD 4-Hour chart
- While 100-day SMA is likely challenging up-moves near 0.7165, a downward slanting trend-line connecting highs marked since late-January may restrict the pair’s advances around 0.7170.
- Should the pair rises past-0.7170, the 0.7200 and 0.7230 are expected resistances that could come forward for buyers while 0.7265 and 0.7295 can please then afterward.
- Meanwhile, 0.7100 and 38.2% Fibonacci retracement of its January-February rally, at 0.7080, seem adjacent rests to watch during a pullback.
- Though, a descending support-line around 0.7037 could challenge the sellers under 0.7080.
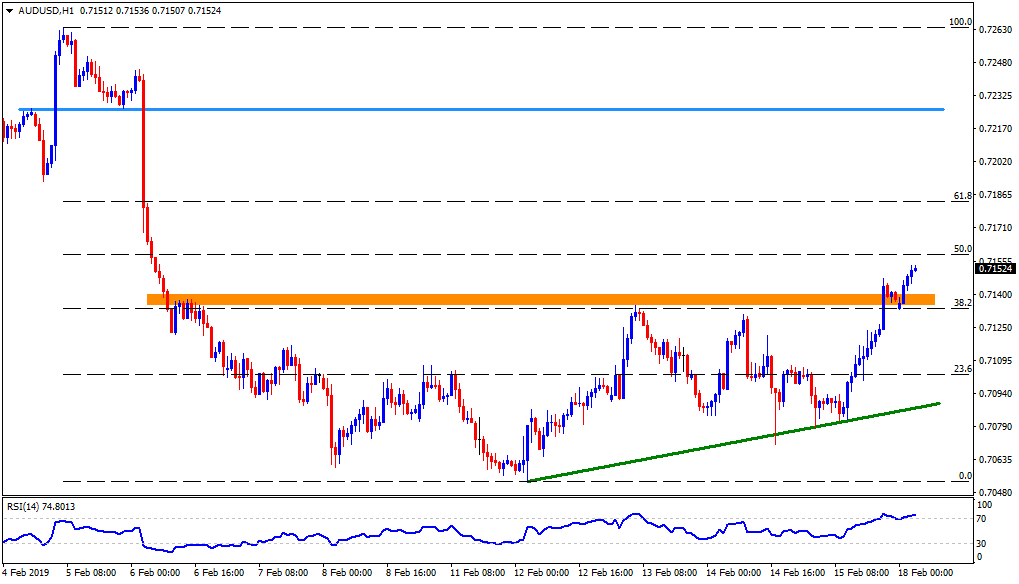
AUD/USD hourly chart
- Contrast to aforementioned timeframes, the hourly chart reflects the pair’s successful encounter of 0.7135-40 resistance-region that maintains the strength to aim for 50% Fibonacci retracement level of 0.7160 and then 0.7185 comprising 61.8% Fibo level of its February downturn.
- During the pair’s rise beyond 0.7185, 0.7225 can try disappointing Bulls, if not then 0.7250 and 0.7265 may become their favorites.
- In case the quote slips under 0.7135, 0.7110 and an upward sloping trend-line, at 0.7085, can offer support, a break of which may reprint 0.7050 on the chart.