USD/CHF Technical Analysis: Swissy ends the week directionless
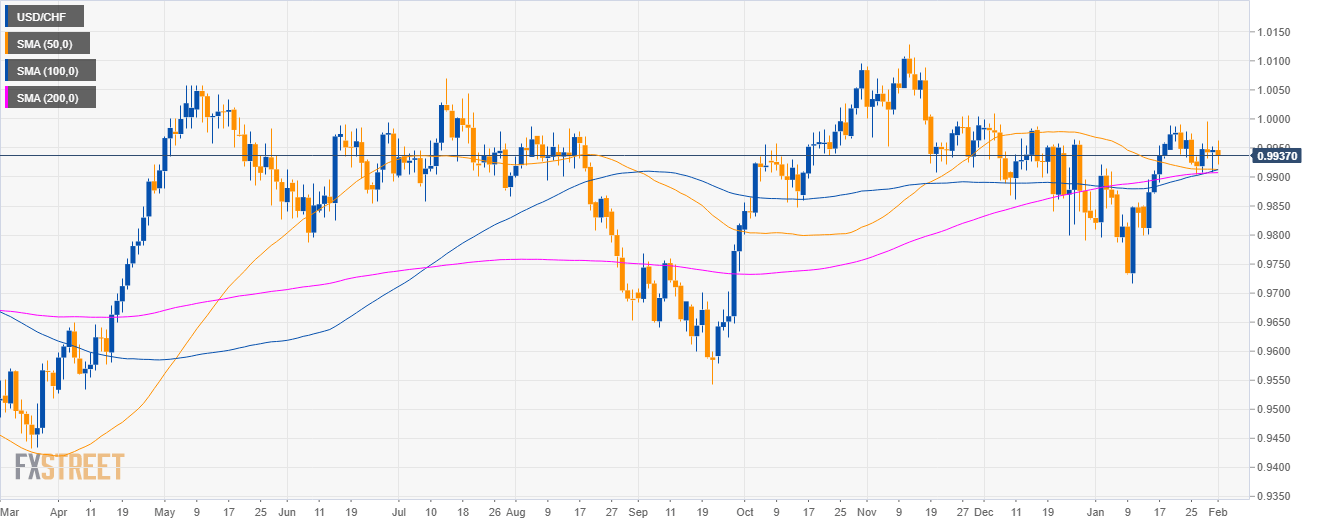
USD/CHF daily chart
- USD/CHF is trading in a sideways trend as the market is above the 50, 100 and 200-day simple moving averages (SMAs).
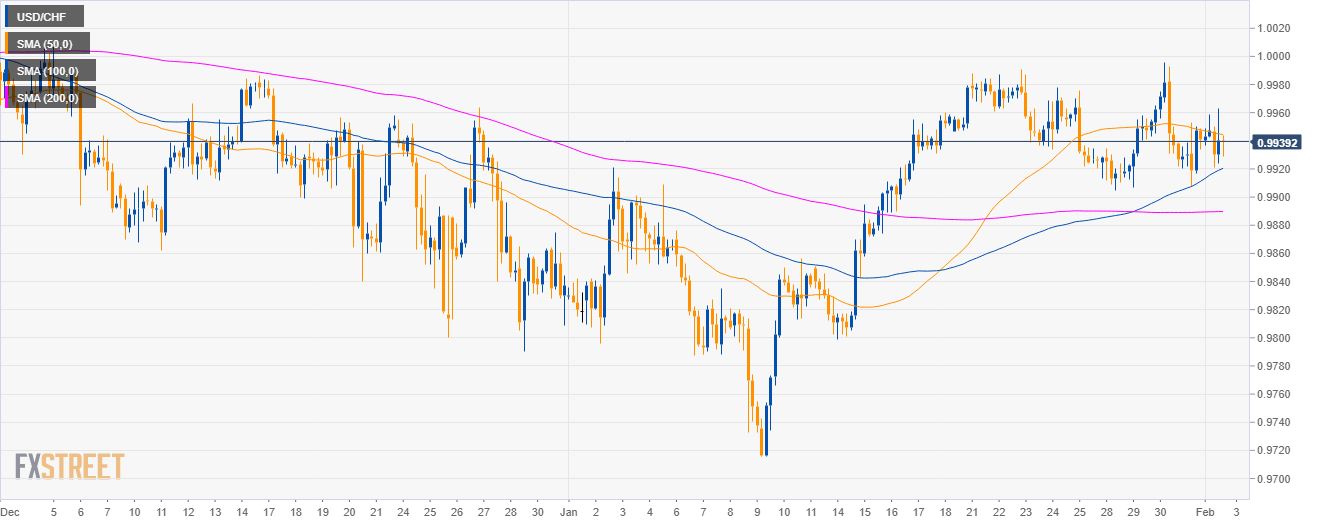
USD/CHF 4-hour chart
- USD/CHF is trading sideways above the 100 and 200 SMAs.
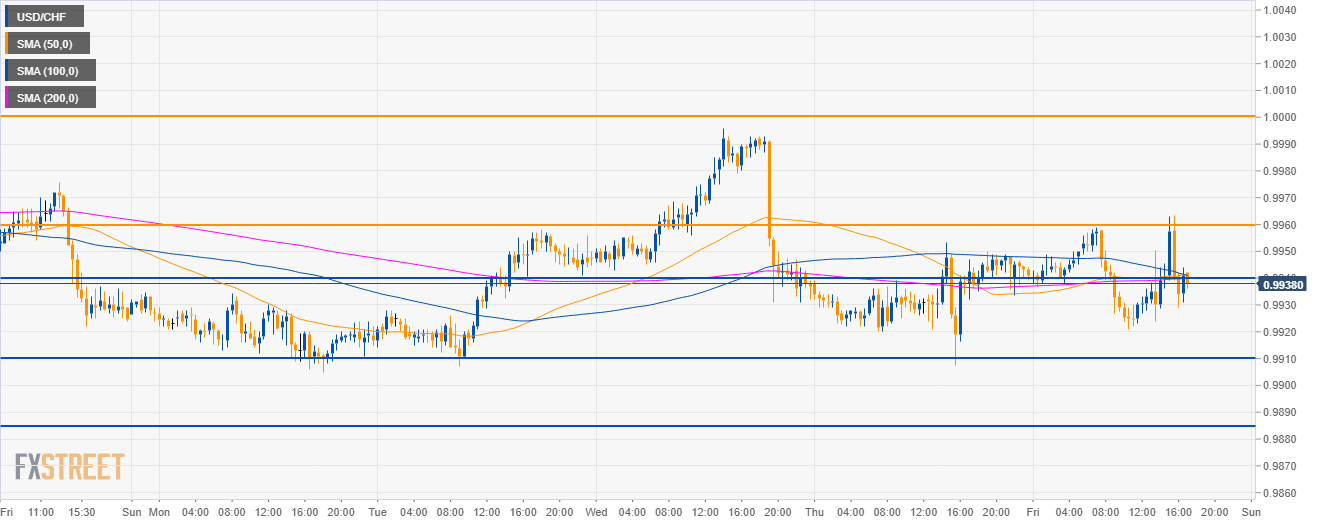
USD/CHF 30-minute chart
- USD/CHF is currently directionless as the SMAs are coiled together.
- Bulls need a break above the 0.9960 resistance while bears a break below 0.9910 support.
Additional key levels
USD/CHF
Overview:
Today Last Price: 0.9941
Today Daily change: -5 pips
Today Daily change %: -0.05%
Today Daily Open: 0.9946
Trends:
Daily SMA20: 0.9896
Daily SMA50: 0.9913
Daily SMA100: 0.991
Daily SMA200: 0.9907
Levels:
Previous Daily High: 0.9953
Previous Daily Low: 0.9908
Previous Weekly High: 0.9991
Previous Weekly Low: 0.9922
Previous Monthly High: 0.9996
Previous Monthly Low: 0.9716
Daily Fibonacci 38.2%: 0.9936
Daily Fibonacci 61.8%: 0.9925
Daily Pivot Point S1: 0.9918
Daily Pivot Point S2: 0.989
Daily Pivot Point S3: 0.9873
Daily Pivot Point R1: 0.9964
Daily Pivot Point R2: 0.9981
Daily Pivot Point R3: 1.001