GBP/JPY Technical Analysis: In consolidation just south of 145.00
- The GBP/JPY pair slipped below the 145.00 level yesterday, dropping from intraday highs in the 145.50 region.
- Brexit concerns have largely dominated the GBP's market flows, and Sterling traders are seeing increasing concerns about the longevity of PM May's current Brexit deal, which faces a tough vote in the UK's House of Commons on December 11th.
GBP/JPY Chart, 5-Minute
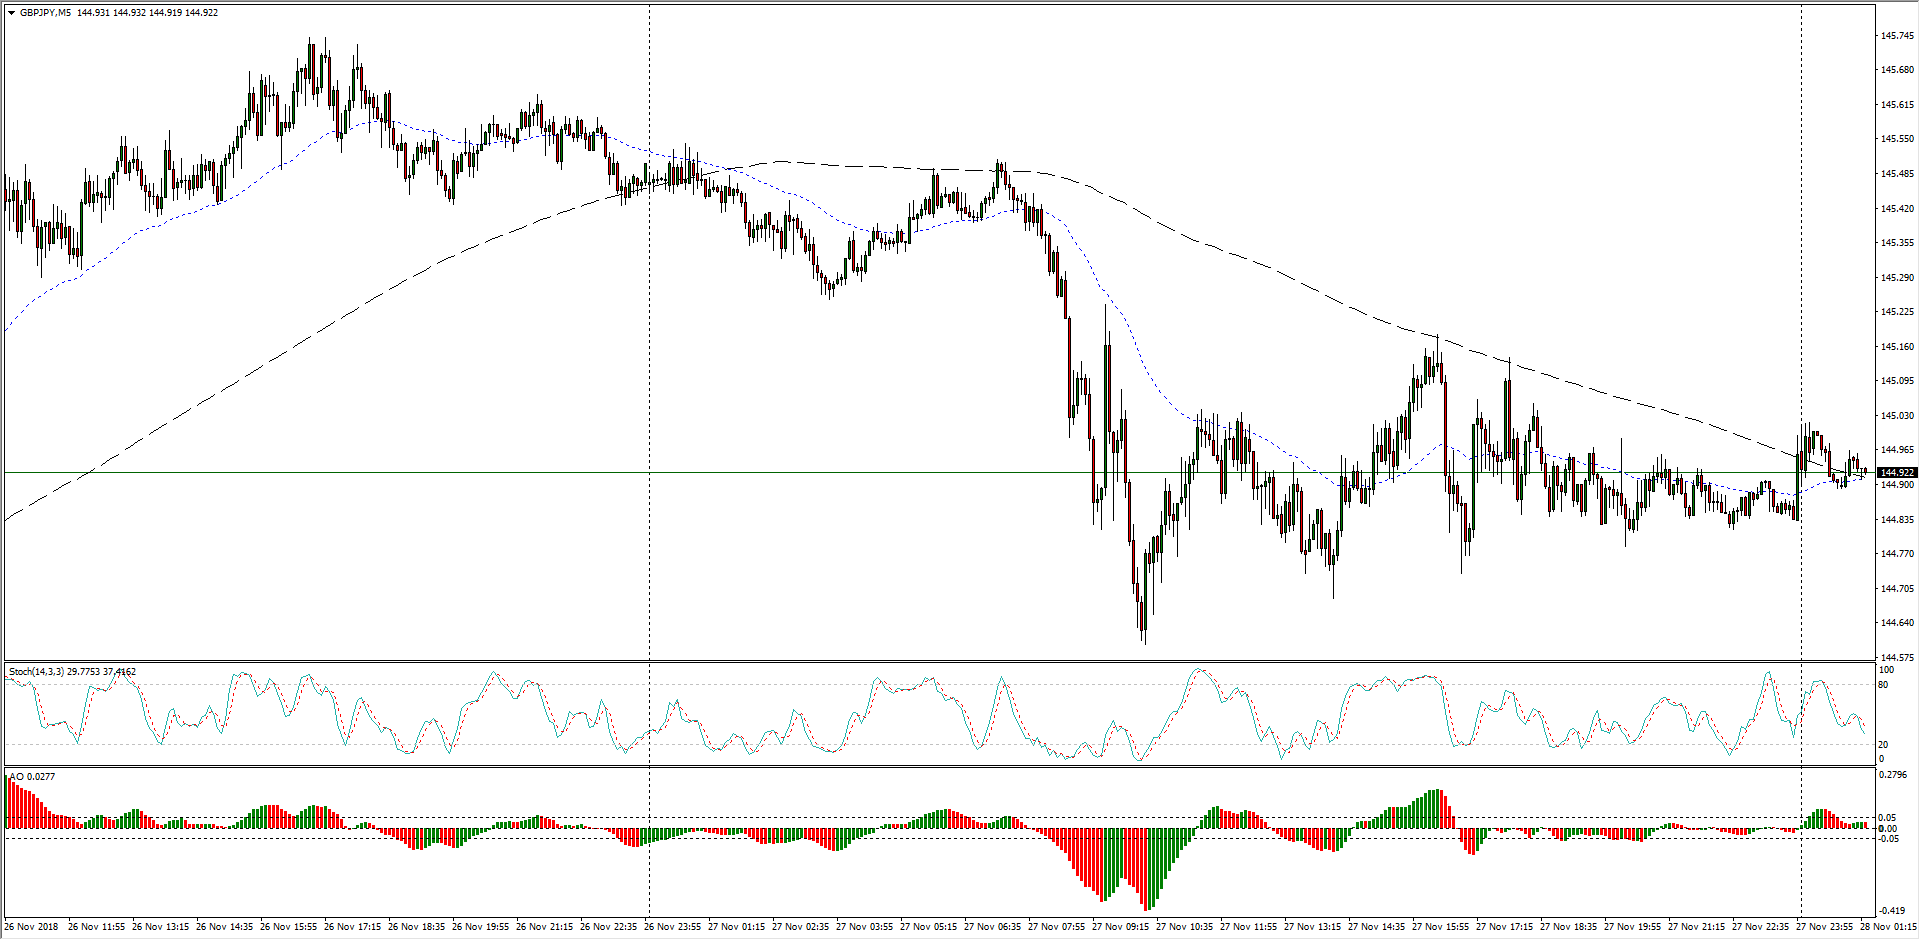
- The Guppy continues to get stuck in a near-term sideways pattern after a stiff drop a couple of weeks ago, slipping loose from the 148.00 handle, and the GBP/JPY has been skidding across the floor between 144.00 and 145.00 for almost two straight trading weeks.
GBP/JPY Chart, 30-Minute

- The last two months have seen the Guppy locked into a rough ranging pattern, and deviations from the 200-period moving average have reverted to the mean indicator, though spending more time towards the downside is seeing the major trend indicator begin to roll over into a bearish lean, and medium-term traders will be looking a fresh bull-run to the 147.00 region or higher before punching in more short-side positions.
GBP/JPY Chart, 4-Hour

GBP/JPY
Overview:
Today Last Price: 144.93
Today Daily change: -64 pips
Today Daily change %: -0.440%
Today Daily Open: 145.57
Trends:
Previous Daily SMA20: 146.16
Previous Daily SMA50: 146.88
Previous Daily SMA100: 145.76
Previous Daily SMA200: 147.05
Levels:
Previous Daily High: 145.76
Previous Daily Low: 144.65
Previous Weekly High: 145.96
Previous Weekly Low: 144.01
Previous Monthly High: 149.52
Previous Monthly Low: 142.78
Previous Daily Fibonacci 38.2%: 145.33
Previous Daily Fibonacci 61.8%: 145.07
Previous Daily Pivot Point S1: 144.9
Previous Daily Pivot Point S2: 144.22
Previous Daily Pivot Point S3: 143.79
Previous Daily Pivot Point R1: 146
Previous Daily Pivot Point R2: 146.43
Previous Daily Pivot Point R3: 147.11