GBP/USD Technical Analysis: Bears keep Cable below 1.2800 figure
- GBP/USD found resistance below the 1.2838 resistance after which Cable retreated below the 1.2800 mark.
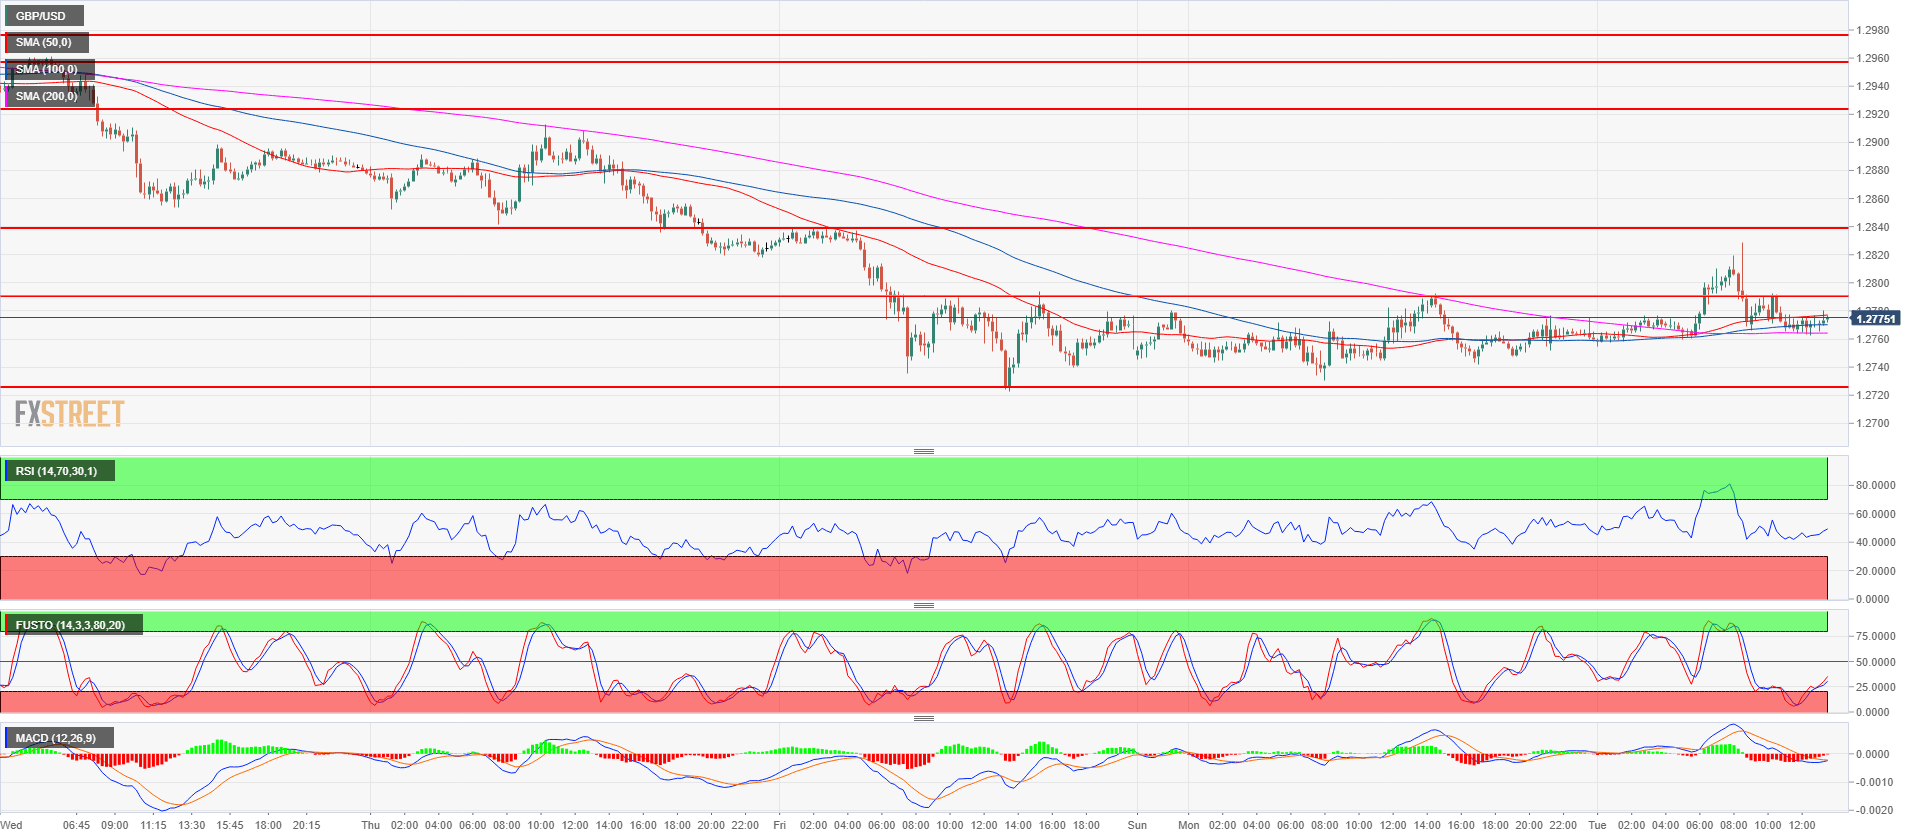
- GBP/USD is having a sideways consolidation after the sharp drop seen recently. GBP/USD is trading above its 200-period simple moving average on the 15-minute chart suggesting that bears are not totally out of the woods just yet. However, the currency pair is vulnerable to the downside as long as it stays below 1.2838 resistance. A breakout above this level would likely lead to a deeper pullback up.
- Bears targets to the downside are located near 1.2723, current 2018 low and at 1.2700 figure.
GBP/USD 15-minute chart
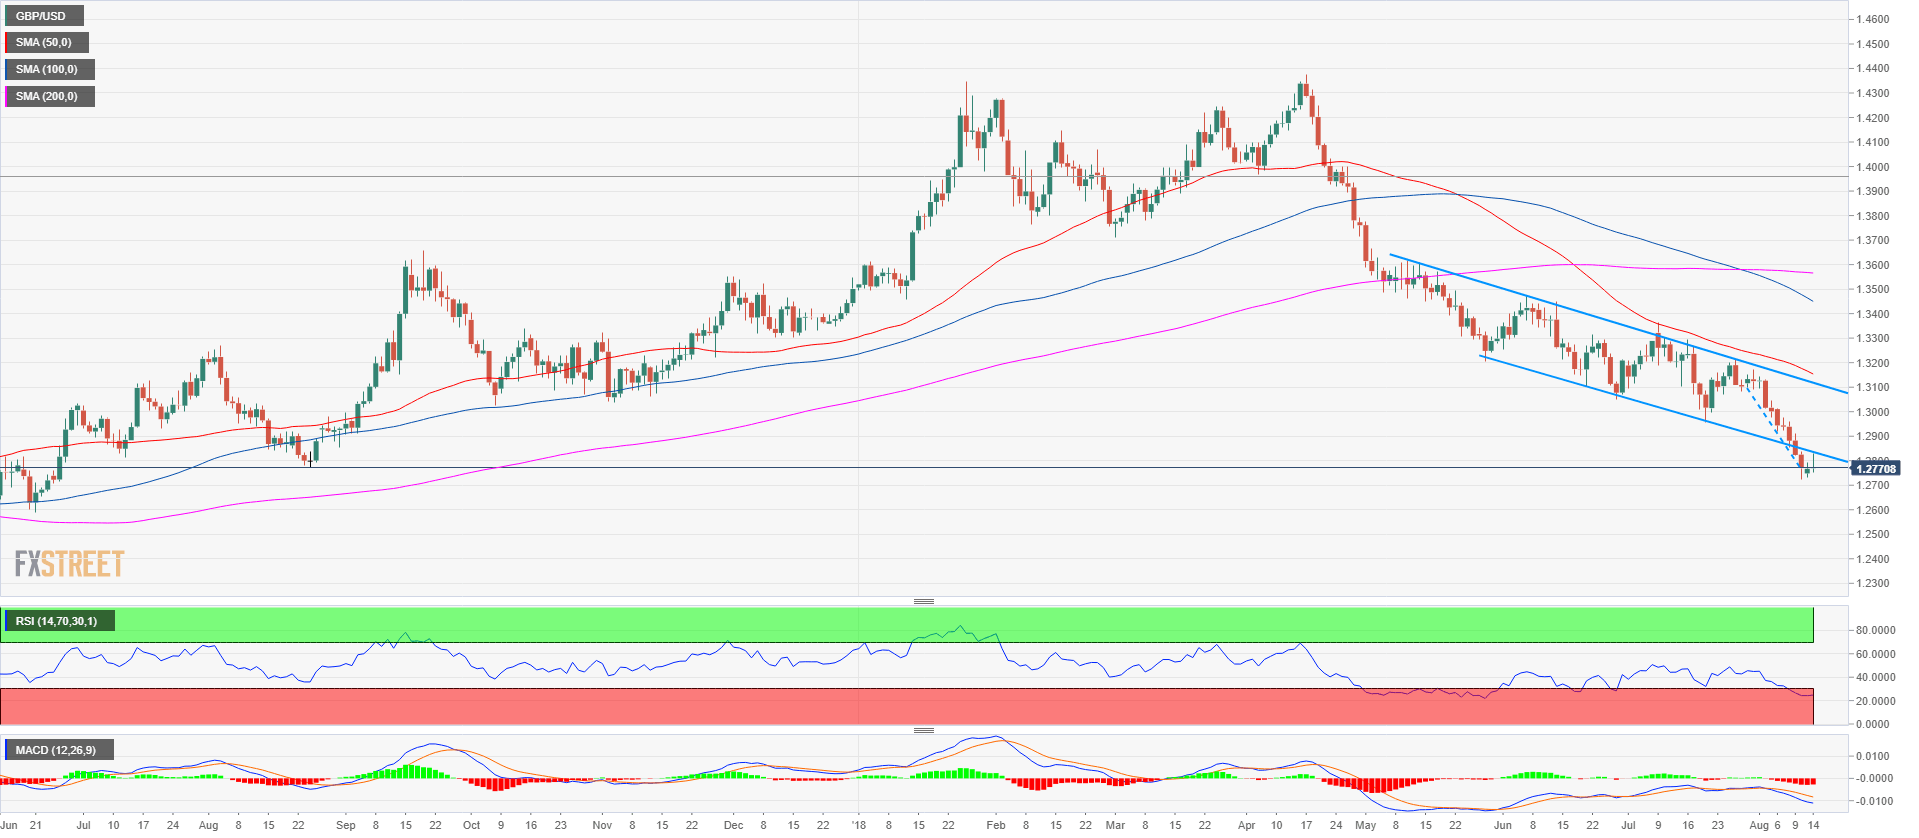
GBP/USD daily chart
Spot rate: 1.2775
Relative change: 0.06%
High: 1.2828
Low: 1.2752
Trend: Bearish
Resistance 1: 1.2789 intraday swing high
Resistance 2: 1.2838, August 10 high
Resistance 3: 1.2900-1.2923 area, figure and August 7 low
Resistance 4: 1.2957 July 17 low
Resistance 5: 1.2975 August 3 low
Resistance 6: 1.3000-1.3010 area, figure and July 18 low
Resistance 7: 1.3049 June 28 low
Resistance 8: 1.3100-1.3076 area, figure and July 24 low
Resistance 9: 1.3155 former breakout point
Resistance 10: 1.3200 figure
Resistance 11: 1.3230 supply level
Resistance 12: 1.3250 June 4 high
Support 1: 1.2723, current 2018 low
Support 2: 1.2700 figure
Support 3: 1.2589 June 21, 2017 low