GBP/USD Technical Analysis: Clocks 13-month low, below mid-1.2700s ahead of UK macro data
• Bears dragged the pair below a short-term descending trend-channel in the overnight trading session and the selling pressure remains unabated for the seventh consecutive session on Friday.
• The ongoing USD upsurge further set off the bearish tone through the early European session and ahead of important UK macroeconomic releases, including the prelim Q2 GDP growth figures.
• A break below the August 2017 low now opens the room for an extension of the well-established bearish trend, albeit near-term oversold conditions might help limit losses, for the time being.
GBP/USD daily chart
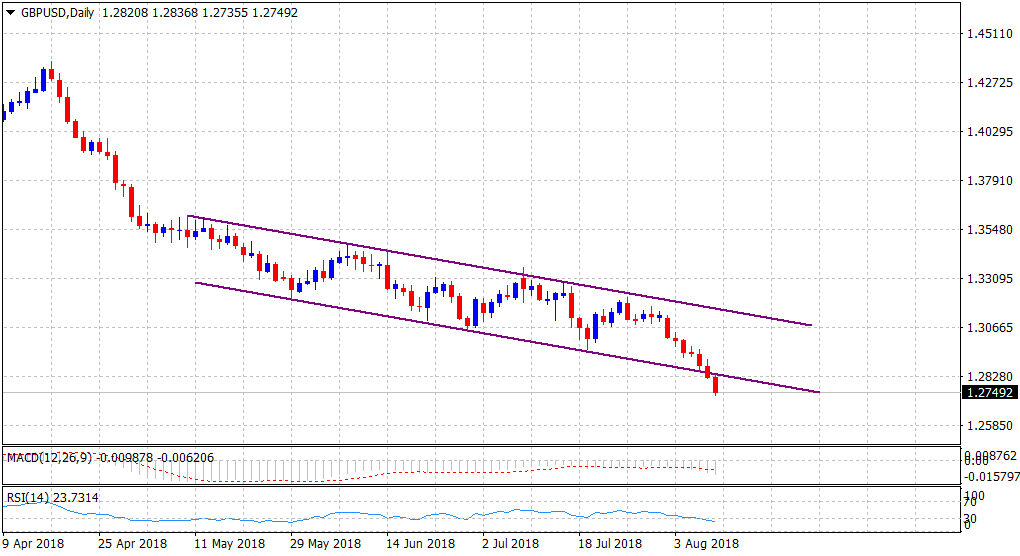
Spot Rate: 1.2749
Daily High: 1.2837
Trend: Bearish, though oversold conditions warrant some near-term consolidation
Resistance
R1: 1.2800 (round figure mark)
R2: 1.2835-40 (trend-channel support break-point)
R3: 1.2884 (R1 daily pivot-point)
Support
S1: 1.2729 (S3 weekly pivot-point)
S2: 1.2700 (round figure mark)
S3: 1.2675 (horizontal zone)