Back
7 Mar 2018
Gold price forecast: Short-term bottom in place
Trade war fears have boosted gold price as expected, confirming a short-term bottom, although only a convincing break above the key trendline resistance would allow a sustained a rally to $1,366 (Jan. 25 high) and above.
Daily chart
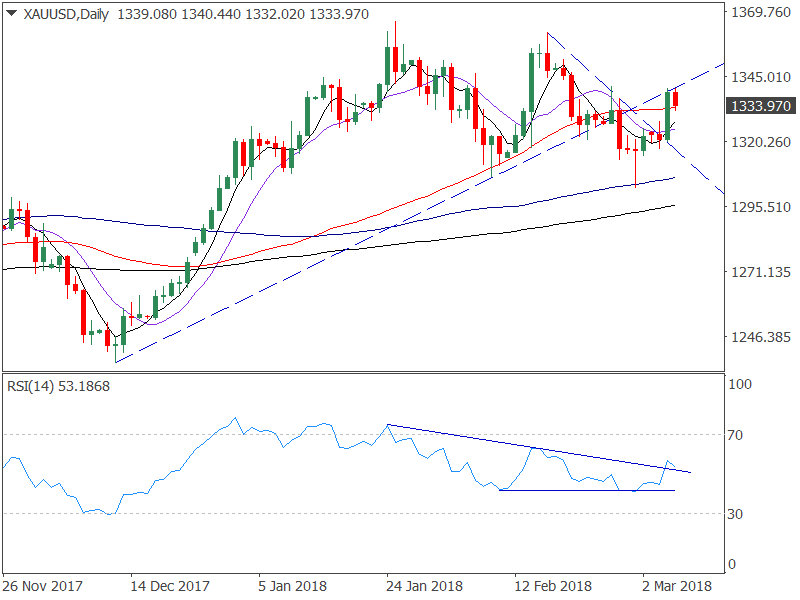
- Last Thursday's long-tailed Doji candle followed by a violation of the falling top pattern (marked by descending trendline) and a rise to $1,340 yesterday suggests the sell-off from the Feb. 16 high of $1,361 has made a temporary low.
- However, only a daily close above the ascending trendline resistance (drawn from the Dec. 12 low and Feb. 8 low) would revive the bullish outlook and open doors for a sustained rally to $1,366 (Jan. 25 high).
- That said, a bullish triangle breakout as seen on the relative strength index (RSI) favors further upside in gold prices.
- On the downside, a daily close below $1,320 (previous day's low) would signal bullish invalidation.