NZD/USD Price Analysis: Breaks out of bottom of range and tumbles
- NZD/USD breaks to fresh lows after breaking out of the bottom of a multi-month range.
- The pair is now oversold and could correct back in the near-term.
- Eventually NZD/USD is likely to continue its descent towards bearish price targets.
NZD/USD has broken out of the bottom of a long-term range and despite reaching oversold extremes is tipped to go even lower.
The NZD/USD had been oscillating within a multi-month range stretching from a floor at about 0.6080 to a ceiling at roughly 0.6210. On Tuesday it decisively broke below the floor and took a step lower – a bearish sign for price.
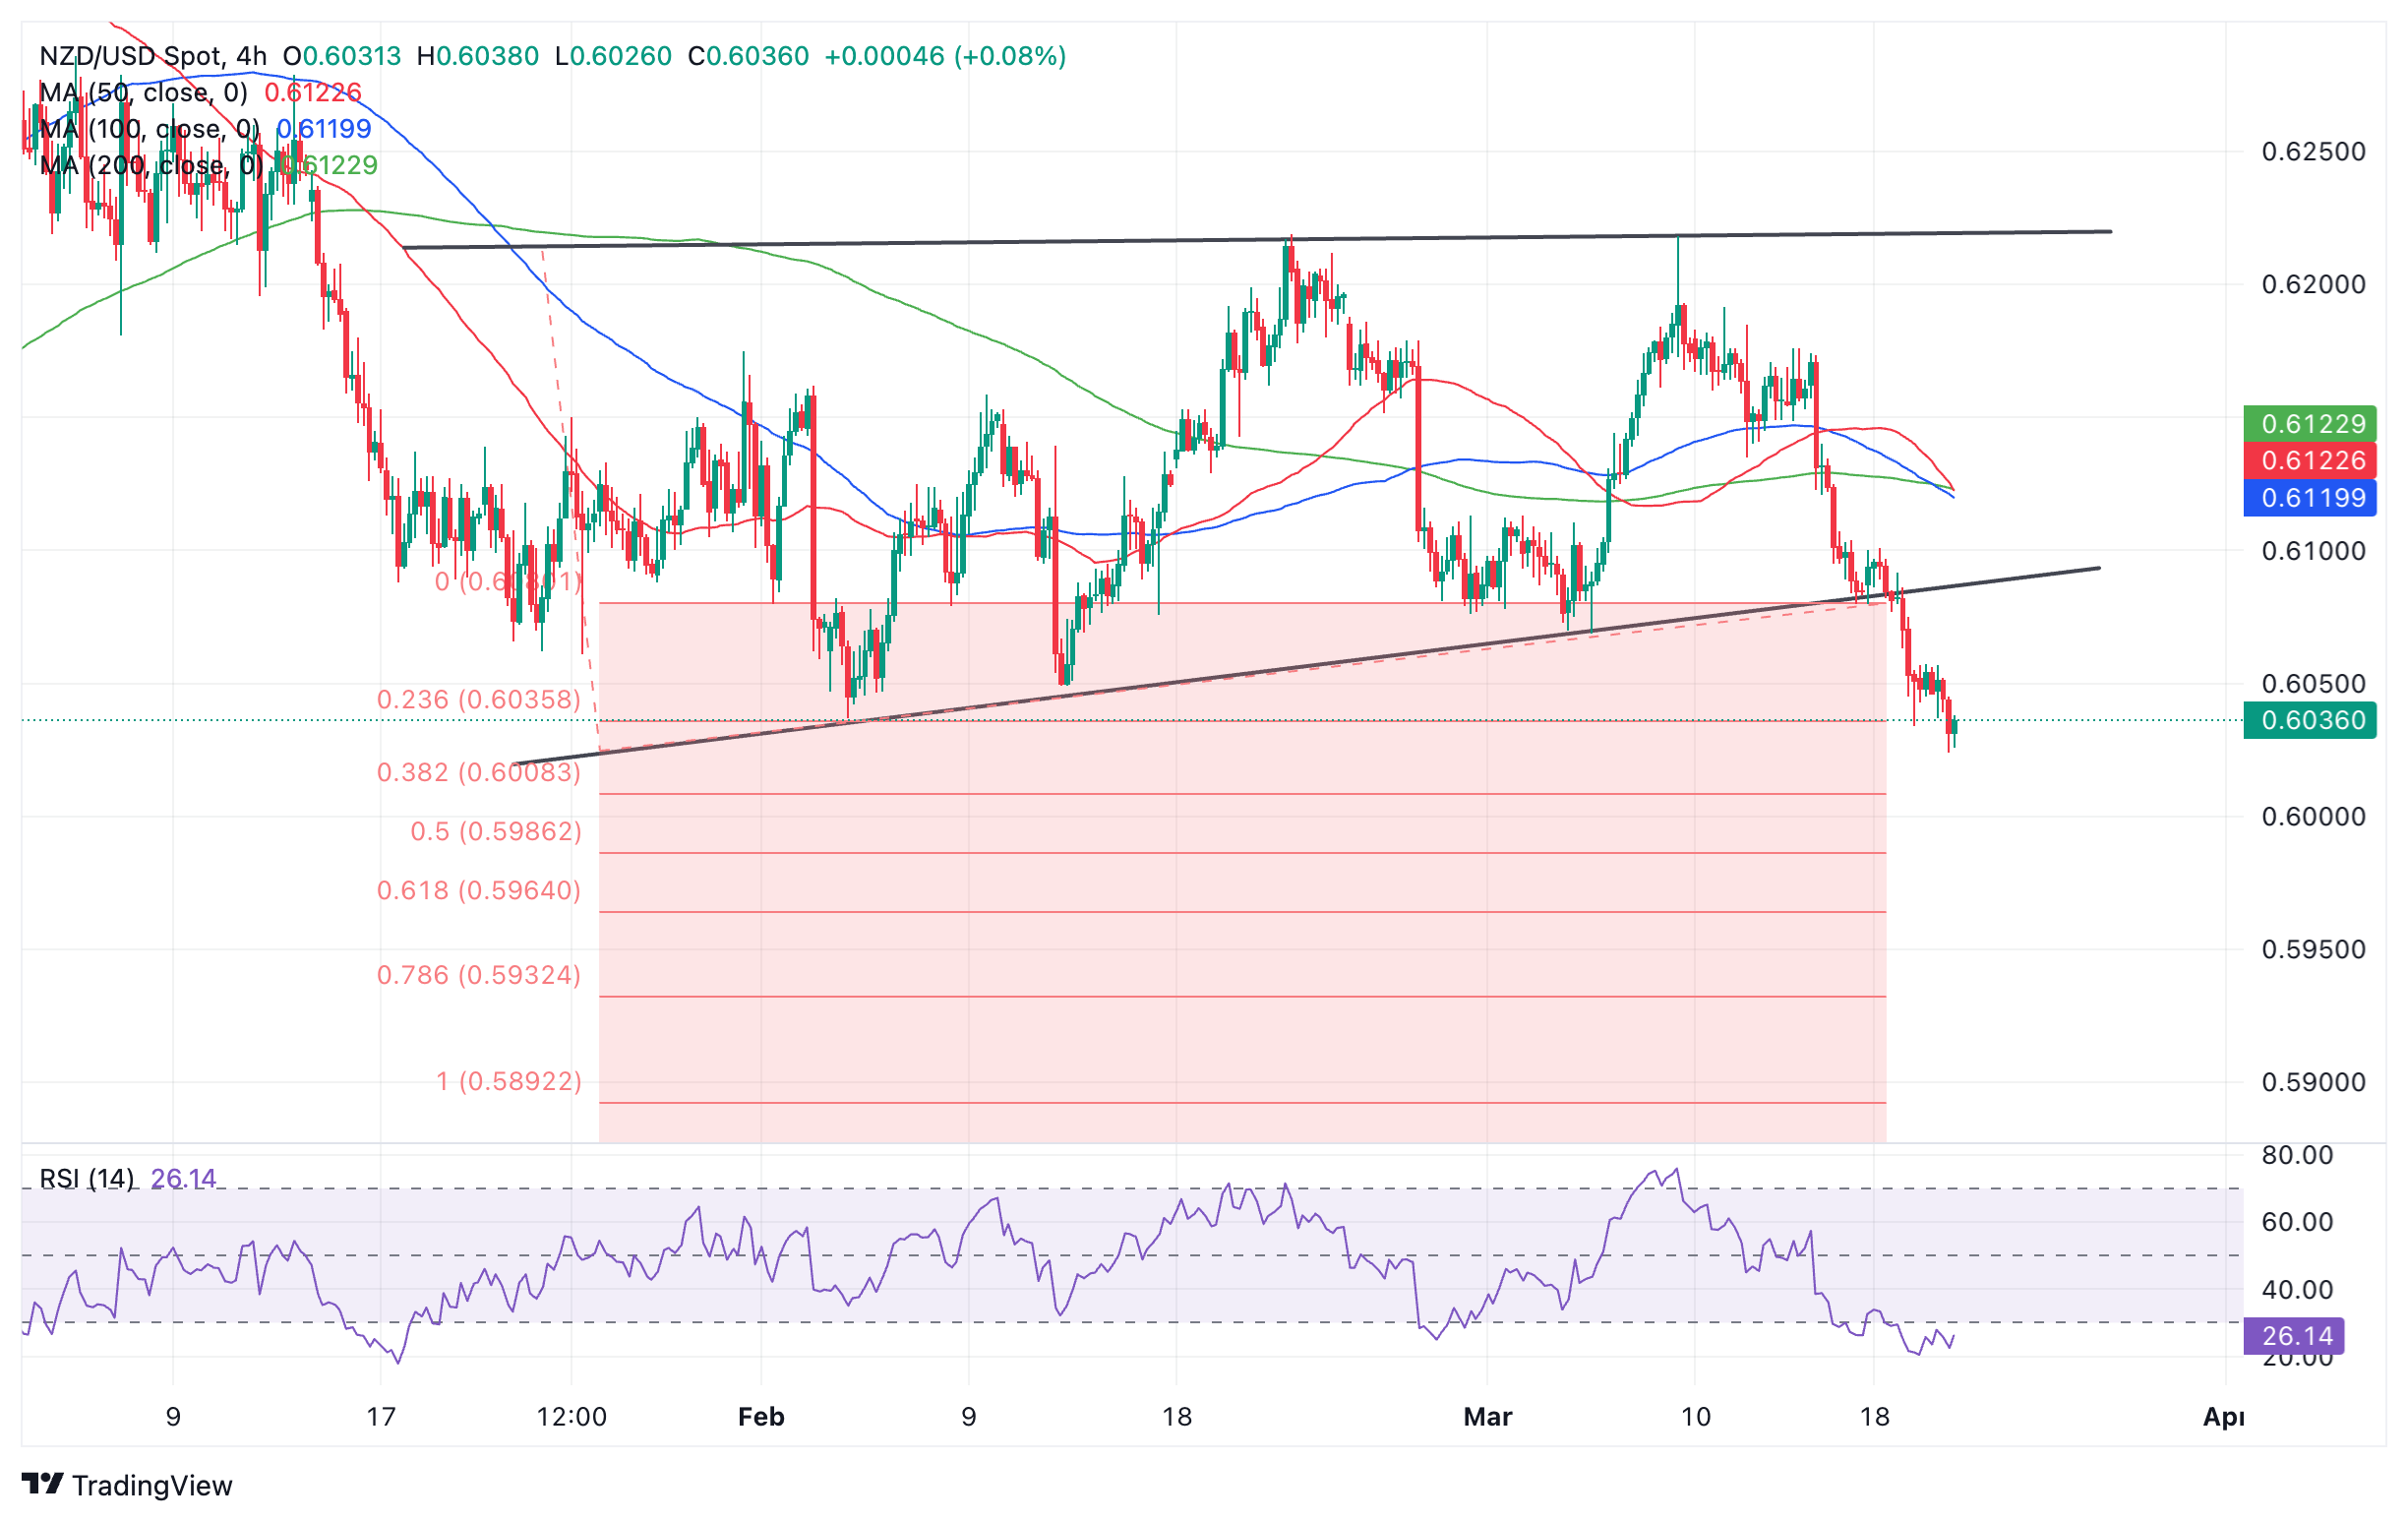
New Zealand Dollar versus US Dollar: 4-hour chart
NZD/USD is currently trading at around 0.6035 and at oversold extremes according to the Relative Strength Index (RSI) momentum indicator. This indicates that there is a possibility the pair could pullback higher. The signal for a would come from the RSI existing oversold and rising again.Traders are advised not to add any more short-orders to their positions whilst the RSI is oversold and to close shorts when the indicator rises out of oversold.
Despite warning signs of a correction the longer-term outlook remains bearish. The pair is in an established short-term downtrend, with progressively lower peaks and troughs in the price action, and given the old adage that “the trend being your friend,” this suggests more downside as probable.
Further, NZD/USD has broken out of a long-term range and according to technical analysis theory the height of the range can be used as a guide to how much lower the pair could go. In the case of NZD/USD it suggests more downside is on the horizon.
The 0.618 Fibonacci ratio of the height of the range extrapolated from the breakout point lower provides an initial target at 0.5964. The 1.000 ratio provides a further target at 0.5892.