Silver Price Analysis: XAG/USD seems vulnerable, ascending trend-line breakdown in play
- Silver consolidates its recent losses to a near three-week low touched on Wednesday.
- The technical setup favours bearish traders and supports prospects for further losses.
- Any attempted recovery could be seen as a selling opportunity and remain capped.
Silver (XAG/USD) struggles to gain any meaningful traction on Thursday and oscillates in a narrow trading band around the $23.00 round-figure mark through the first half of the European session. The white metal, meanwhile, remains close to a three-week low touched on Wednesday and seems vulnerable to prolonging the descending trend witnessed over the past week or so.
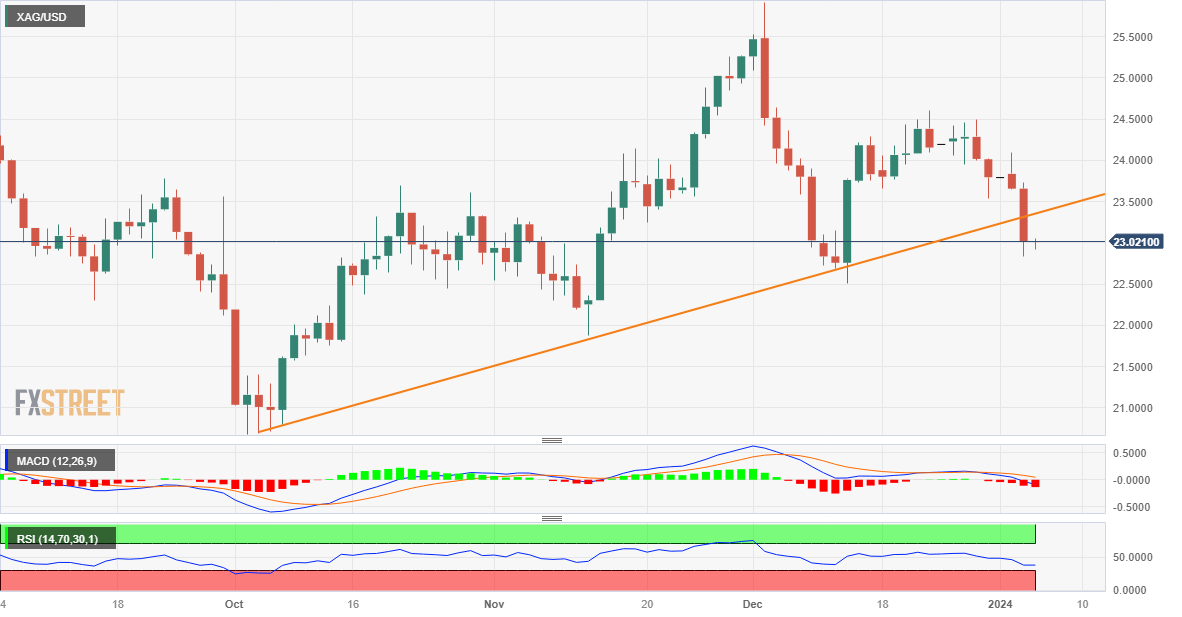
From a technical perspective, the overnight breakdown and close below an ascending trend-line extending from the October 2023 low was seen as a fresh trigger for bearish traders. Furthermore, oscillators on the daily chart have been gaining negative traction and validate the near-term negative outlook, suggesting that the path of least resistance for the XAG/USD is to the downside.
Hence, a subsequent slide towards testing the December monthly swing low, around the mid-$22.00s, looks like a distinct possibility. The downward trajectory could get extended further towards the next relevant support near the $22.25 region en route to the $22.00 round-figure mark.
On the flip side, the ascending trend-line support breakpoint, around the $23.30-$23.35 area, now seems to act as an immediate strong barrier. Any subsequent move up is likely to attract fresh sellers near the $23.55 zone and remain capped near the $23.80 horizontal barrier. A sustained move beyond might trigger a short-covering rally and lift the XAG/USD beyond the $24.00 mark.
Some follow-through buying will suggest that the recent corrective decline has run its course and lift the XAG/USD further towards the $24.60 area (December 22 high). Bulls might eventually aim back towards reclaiming the $25.00 psychological mark.
Silver daily chart
Technical levels to watch