WTI Price Analysis: Bears eye a run towards $7bbls
- The 4-hour chart offers a head and shoulders scenario for WTI.
- We have already seen a break of structure, BoS, then this gives kudos to the downside bias with $70.00 eyed.
West Texas Intermediate, WTI, crude oil rose for a fourth-straight session Tuesday on optimism due to the reopening of China's borders. There is also speculation that the Federal Reserve is on the way to pivoting and this pouts this week's red calendar event, Consumer Price Index, in focus.
The US is expected to report inflation slowed again in December, easing pressure on the Federal Reserve to further slow the economy and therefore create a cheaper US Dollar environment for overseas investors of oil that could come in more demand.
Nevertheless, the technical outlook could be painting a conflicting scenario. Tuesday's price action could be deemed as a liquidity hunt before the next major move to the downside as the following will illustrate:
WTI weekly chart
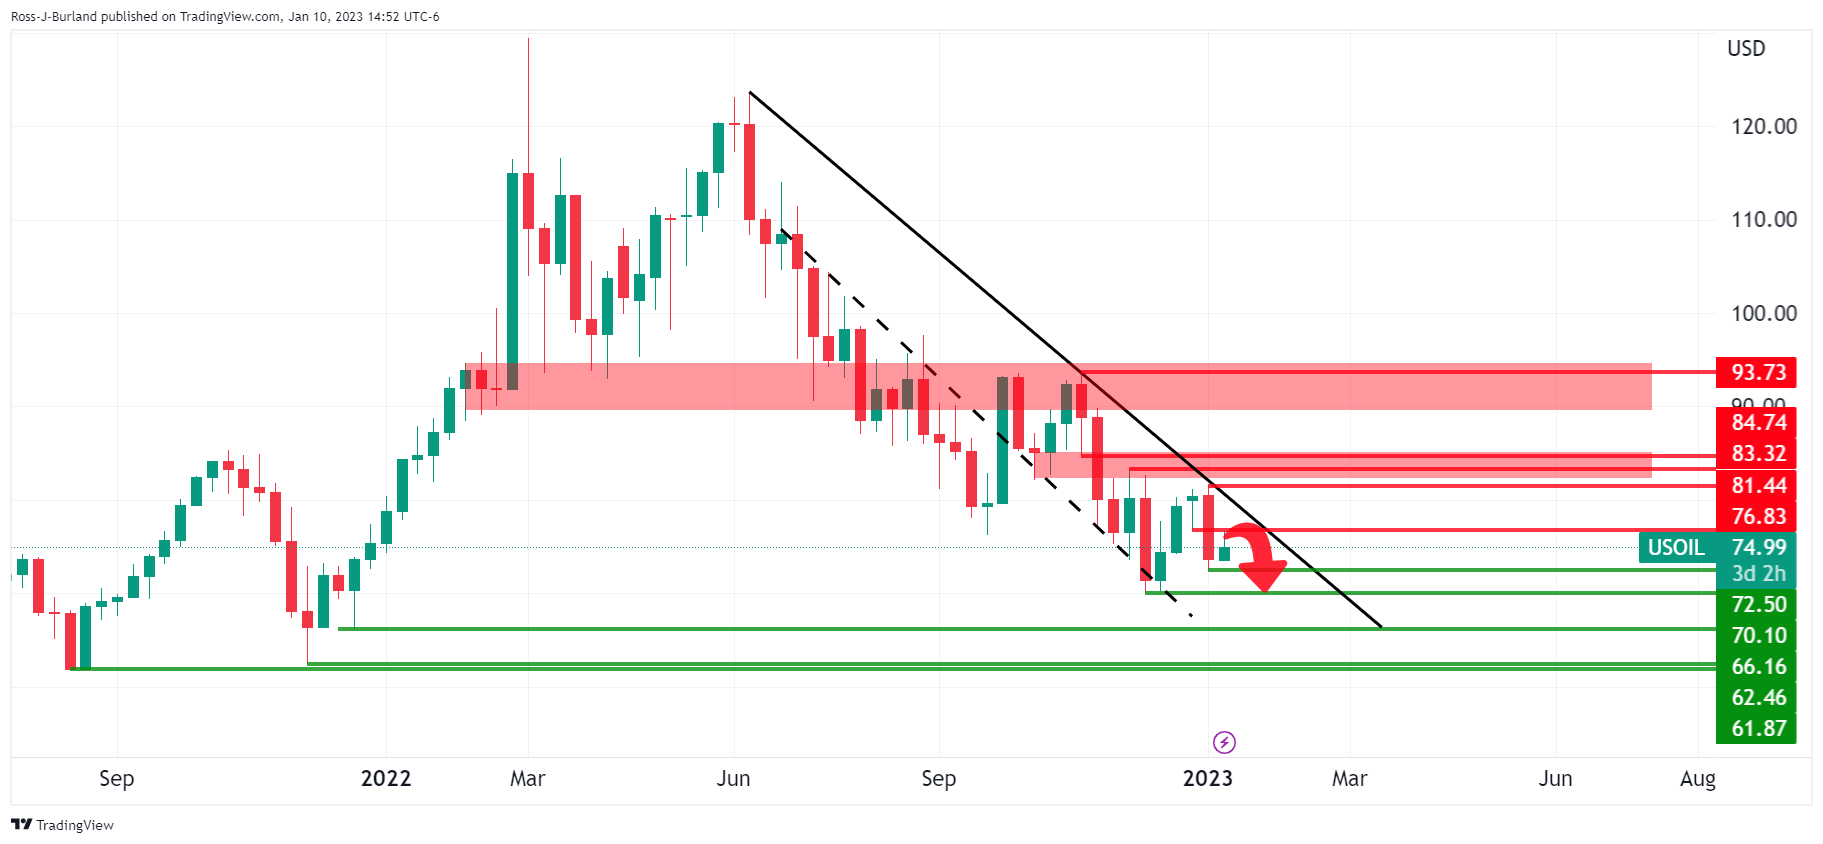
There is a bearish bias while being on the front side of the weekly trend and the build-up of horizontal resistances.
WTI daily charts

The daily M-formation is compelling as the neckline is resisting bullish advances towards a 50% mean reversion.
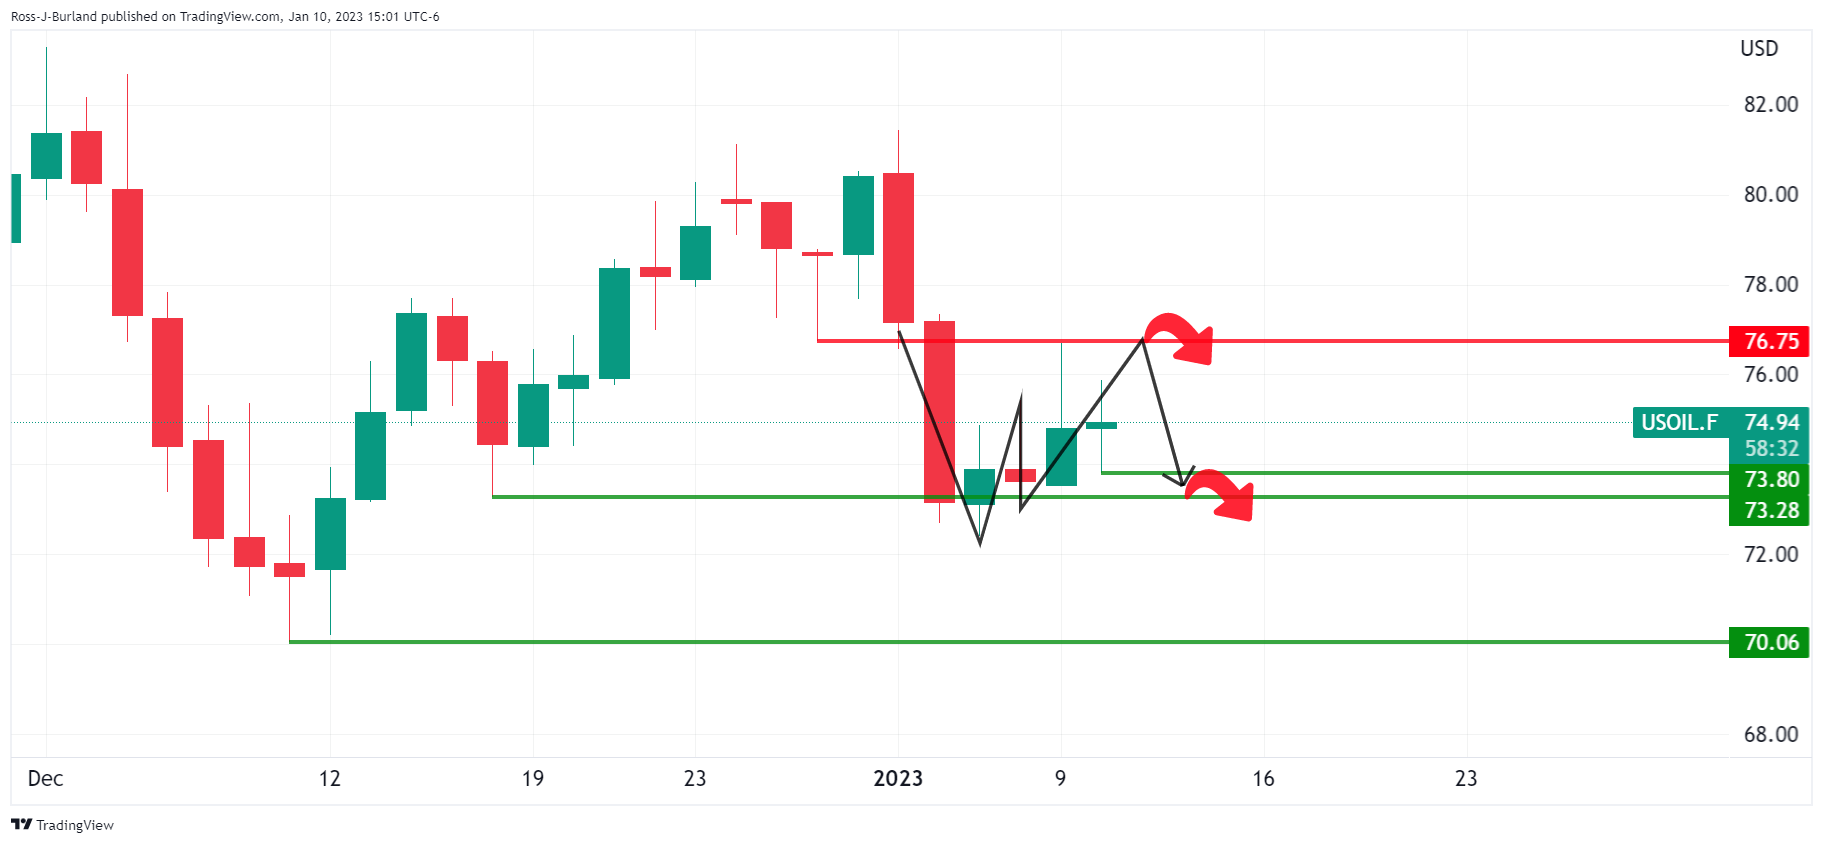
Futures charts show the Ww-formation taking shape, so a pull on the price would be expected, at least while below the $76.70s.
WTI H4 chart

The 4-hour chart offers a head and shoulders scenario and given we have already seen a break of structure, BoS, then this gives kudos to the downside bias fore the foreseeable future with $70.00 eyed.
