Silver Price Analysis: XAG/USD stills negative around $20.80s after jumping off a two-week low
- Silver Price forms a candlestick hammer in the daily chart after hitting a two-week low at around $20.50s.
- The Relative Strength Index on the hourly chart crossed the 50-midline, bolstering XAG.
- If XAG/USD breaks above $20.90s, Silver will rally toward $21.00; otherwise, it will consolidate around $20.50.
Silver Price prolongs its losses after rallying to a multi-month high around $22.25, and plunges below the 200-day Exponential Moving Average (EMA), as broad US Dollar (USD) strength weighs on the white metal. Hence, the XAG/USD is trading at $20.85, beneath its opening price by 0.56%, after hitting a daily high of $21.00 a troy ounce.
Silver Price Analysis: Technical outlook
From a technical perspective, the XAG/USD is neutral-to-upward biased, as shown by the daily chart. On Monday, the XAG/USD broke below the October 4 swing high of $21.24, exacerbating a fall below the $21.00 mark. Even though the white metal achieved a fresh two-week low of $20.58, the Silver Price is forming a hammer, meaning that buyers stepped in around $20.50 as they prepare to assault the 200-day ENA at $21.41.
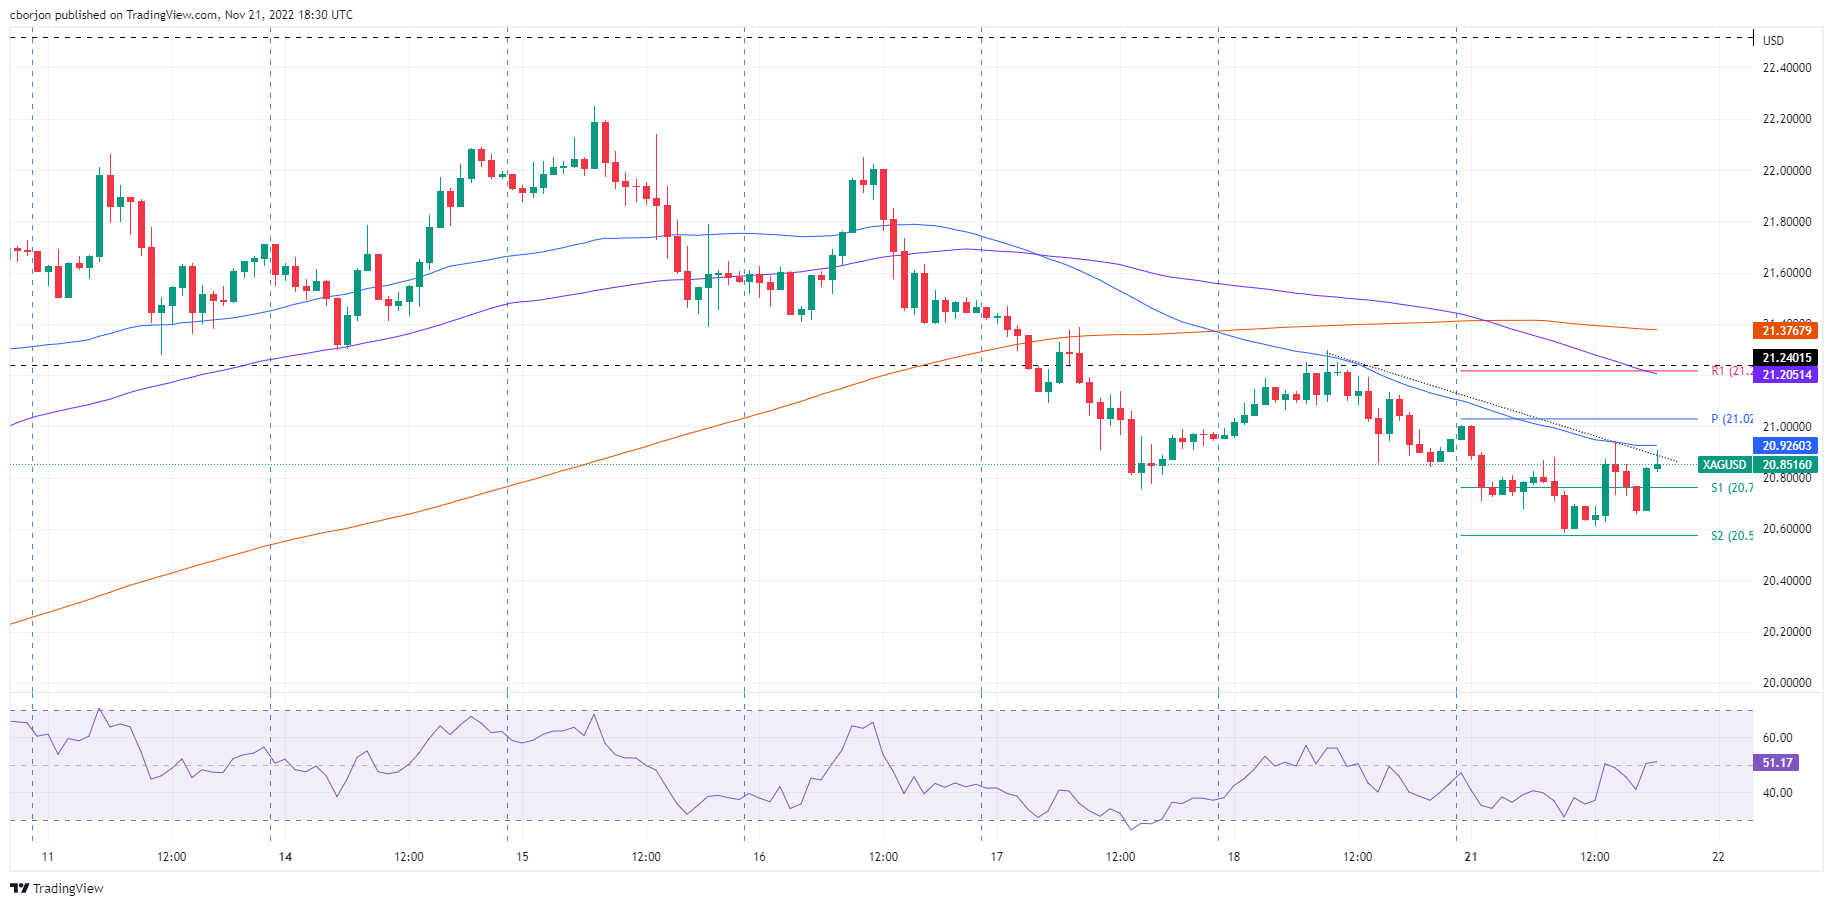
In the near term, the XAG/USD hourly chart portrays Silver bottoming around the S2 daily pivot around $20.60, further supported by the Relative Strength Index (RSI), crossing above the 50-midline. At the same time, the XAG/USD tests the confluence of a resistance trendline and the 50-hour EMA around $20.92, which, once cleared, will expose the $21.00 psychological price level.
That said, the XAG/USD first resistance would be the previously mentioned confluence, followed by $21.00, the intersection of the R1 daily pivot, and the 100-hour EMA at $21.20. On the flip side, the XAG/USD first support would be the S1 pivot at $20.76, followed by the S2 daily pivot at $20.57.
Silver Key Technical Levels