GBPUSD Price Analysis: Flirts with 1.1860 support amid bearish RSI divergence
- GBPUSD bounces off intraday low but snaps two-day uptrend.
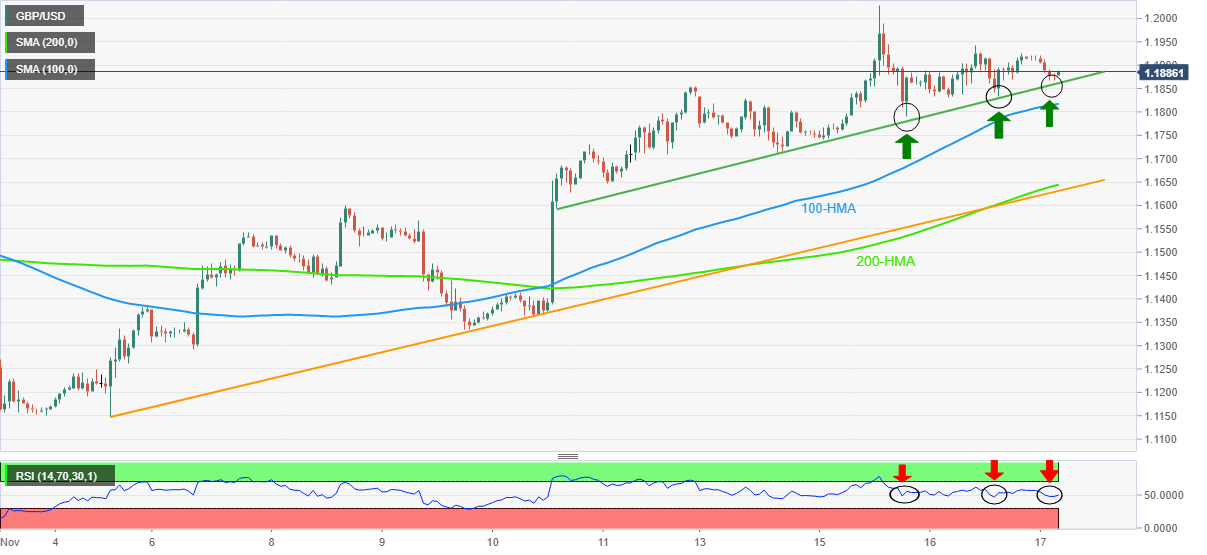
- Bearish RSI divergence, lower-high formation teases sellers.
- Weekly support line, 100-HMA challenges immediate downside.
GBPUSD pares the first daily loss in three around 1.1880 heading into Thursday’s London open. In doing so, the Cable pair bounces off the intraday low but stays on the seller’s radar while printing a bearish divergence on the Relative Strength Index (RSI) placed at 14.
The higher-low on prices don’t accompany the RSI conditions and joins the three-day formation of lower highs to keep the GBPUSD bears hopeful as they await the UK’s Autumn Statement.
However, an upward-sloping trend line from the last Thursday restricts the quote’s immediate downside to around 1.1860.
Following that, the 100-HMA level of 1.1817 could act as an extra downside filter before directing the GBPUSD sellers towards the 200-HMA surrounding 1.1645.
It’s worth noting that a two-week-old ascending trend line, around 1.1630 by the press time, could challenge the Cable pair’s weakness past 1.1645.
On the contrary, recovery moves need to cross the recent swing high of around 1.1925 to defy the lower-high formation and direct buyers toward the monthly peak of 1.2030.
In a case where GBPUSD remains firmer past 1.2030, the August month high near 1.2280 could gain the market’s attention.
GBPUSD: Hourly chart
Trend: Further weakness expected