USDCAD Price Analysis: Bulls moving in and eye a 382% Fibo
- USDCAD is moving to the upside in a correction of the recent bear trend.
- The bears eye the bullish trendline for the weeks ahead.
USDCAD staged a correction in the middle of the week as the following charts illustrate. The greenback is under pressure still and the data on the domestic chart remained steady as expected at 6.9%, but core common came in at 6.2% YoY vs. 5.9% expected and a revised 6.2% (was 6.0%) in September. This initially supported the CAD but overall price pressures appeared to have peaked. The Bank of Canada next meets on December 7 and a 25 bp hike to 4.0% is expected. There is a long time between now and then and this gives rise to prospects of a meanwhile correction as follows:
USDCAD weekly chart
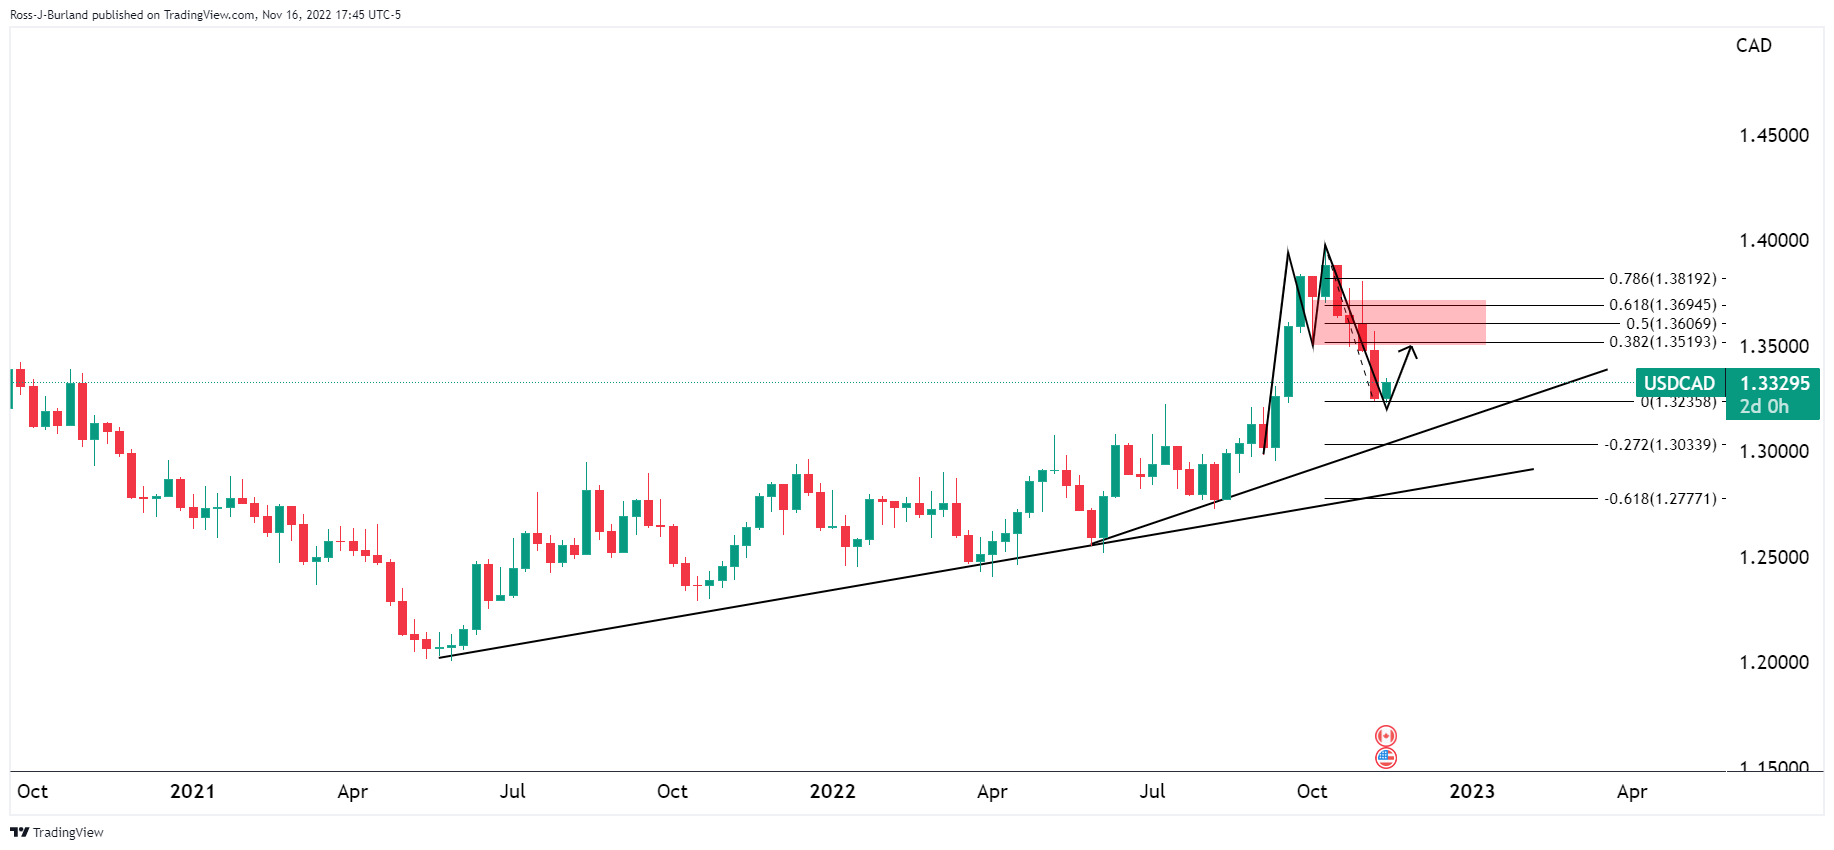
The M-Formation is a compelling bullish feature, but there could still be some downside to come.

A break of the support opens up the way to dynamic trendline support, although the bulls are firming and the 38.2% Fibonacci is eyed for the days ahead.