


Dragonfly Doji candlestick: meaning
How the Dragonfly Doji candlestick is structured
Limitations of the Dragonfly Doji pattern
How to read the Dragonfly candlestick
How to trade using the Dragonfly Doji pattern
The term 'Dragonfly Doji candlestick' may seem intimidating for beginner traders, but it represents a crucial tool that can lead to significant results. This article will explore this pattern and explain how to use it effectively and judiciously.
A dragonfly Doji is an essential candle in the world of trading because when it is present, it gives traders a sign that the trend might end. The candle looks like a dragonfly and tends to appear after a bearish trend.Dragonfly Doji candlestick: meaning
Here's how it works: imagine a day when the price drops a lot but bounces back up by the end of the day, so it's almost the same as where it started. This means that even though some traders were selling (which pushed the price down), sellers started to lose control as more traders pulled buying pressure, pushing the price up. So, the Dragonfly Doji candlestick hints that prices could increase soon.
This pattern was invented in Japan in the 1700s and has been used in financial analysis in the Western world for over 100 years. When you see a Dragonfly Doji candle, there's a chance that the price will go up afterwards, so you might consider buying.
This formation consists of three parts. Imagine you're looking at a chart showing how the price of an asset changes over time. The Dragonfly candlestick looks like a big 'T' because it has a long line going down (the lower shadow) and a tiny line on top (the upper shadow). Here's what happens when this pattern shows up.How the Dragonfly Doji candlestick is structured
1. Downtrend
2. Dragonfly pattern
3. Uptrend
You need to know more than just how to spot the Dragonfly Doji to achieve trading success. Here's what you should know about its limitations. By knowing that the Dragonfly Doji has limitations, analysts can use it as part of a more extensive strategy combining different tools and ideas.Limitations of the Dragonfly Doji pattern
The Dragonfly Doji appears after prices have been going down for a while. To spot it, look for a candle that's about average size or even bigger than the others around it. A larger candle means much trading, which shows that people are interested in that currency pair. Next, focus on the long lower wick, the spike sticking out below the central part of the candle. This spike should be much longer than the body of the candle itself. Why is this important? It shows that the price dropped a lot then but bounced back up to close near where it started. This means buyers came in and showed interest in those lower prices, which could hint at a change in the price direction. Lastly, check for a small body at the top of the candle. The body is the thicker part of the candle, and in a Dragonfly Doji, it should be small and located in the upper third of the overall candle. It should be almost non-existent, meaning the opening and closing prices are very close. This small body shows buyers and sellers reached a balance after all that up-and-down movement, suggesting a price rise ahead.How to read the Dragonfly candlestick
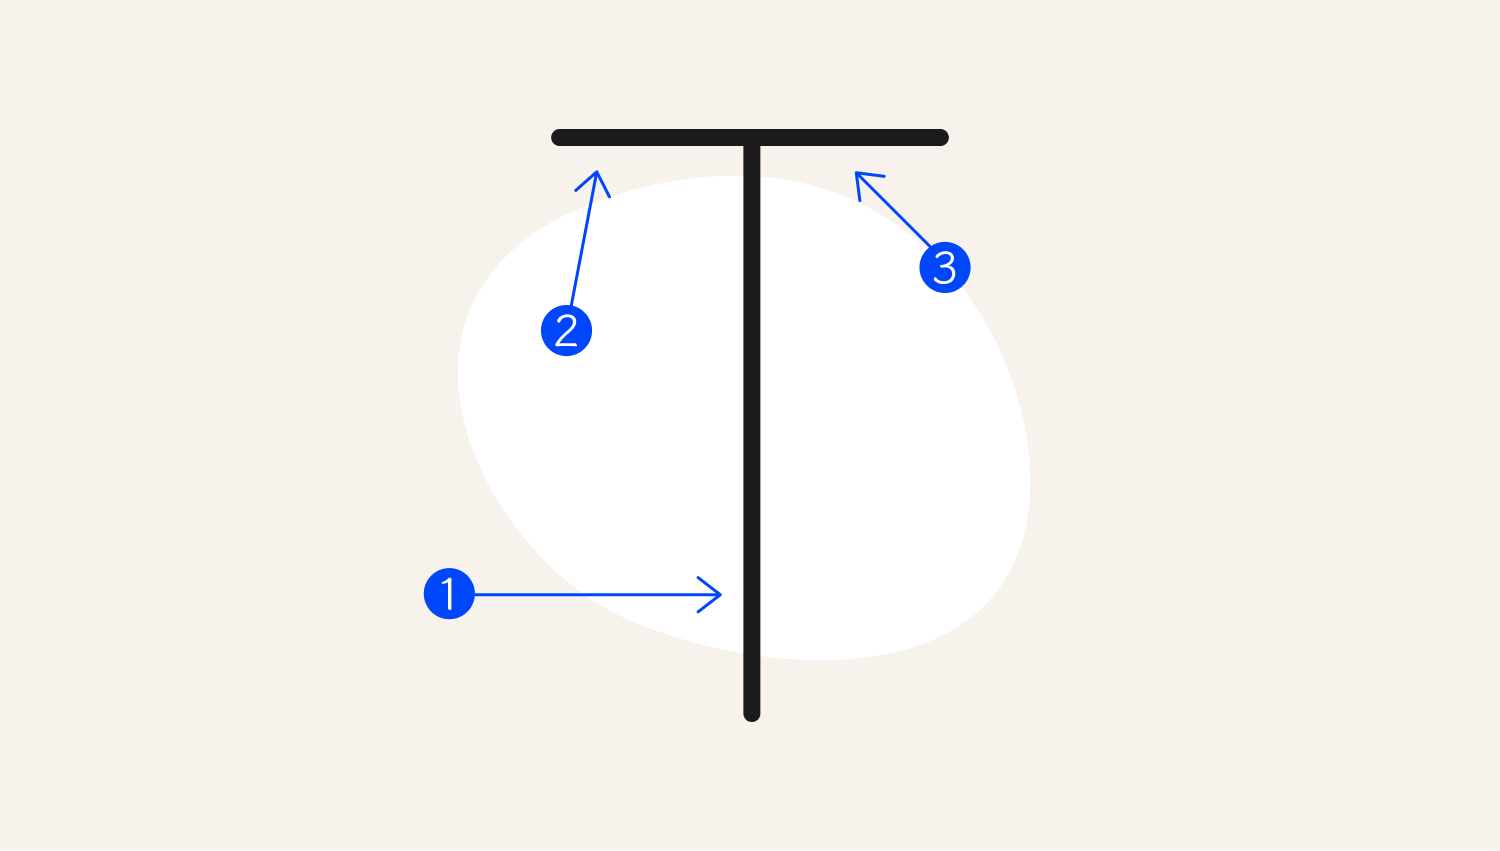
The structure above shows the anatomy of a Dragonfly candle.
- Long wick
- Opening price
- Closing price
So, when analysing the Dragonfly Doji, traders should keep in mind five essential pieces of advice.
- Look for it after a price drop.
- Check for a long lower shadow (meaning buyers pushed prices back up).
- See if the body is small (indicating little price change).
- Ensure there's no upper shadow (which shows prices couldn't go higher).
- Remember that this pattern is just one clue among many.
Examples
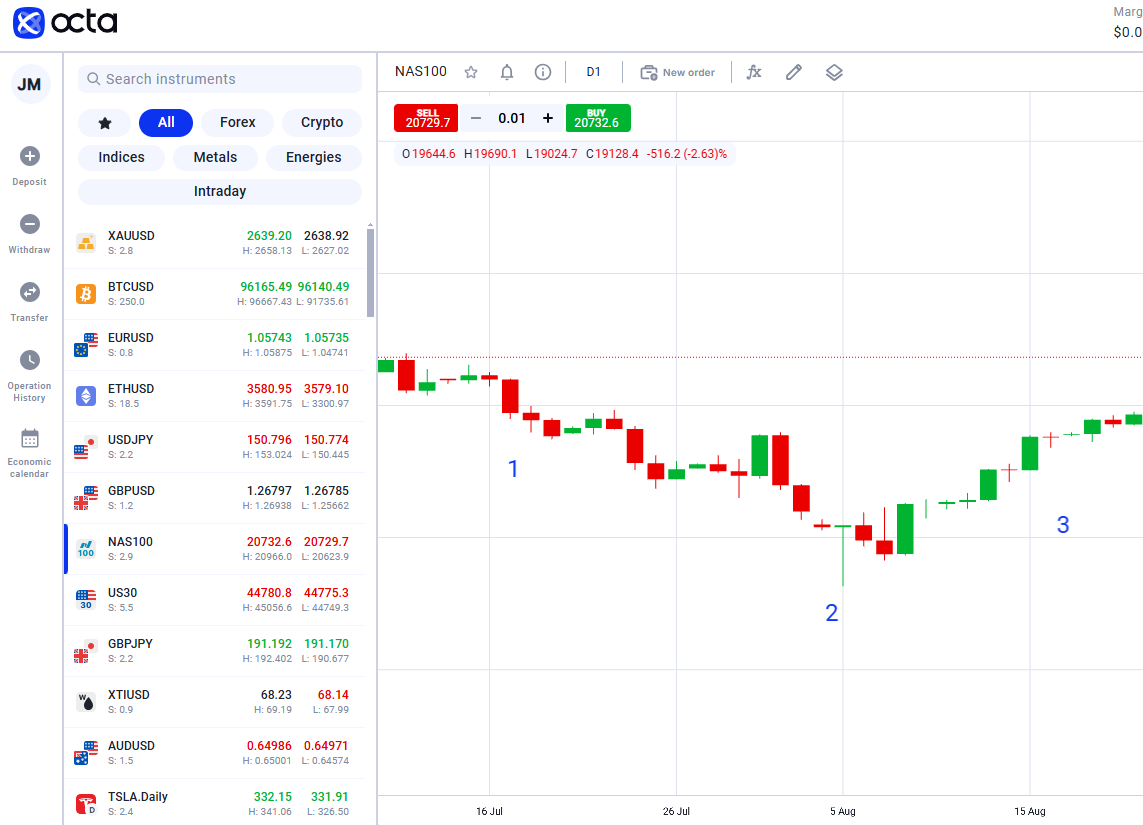
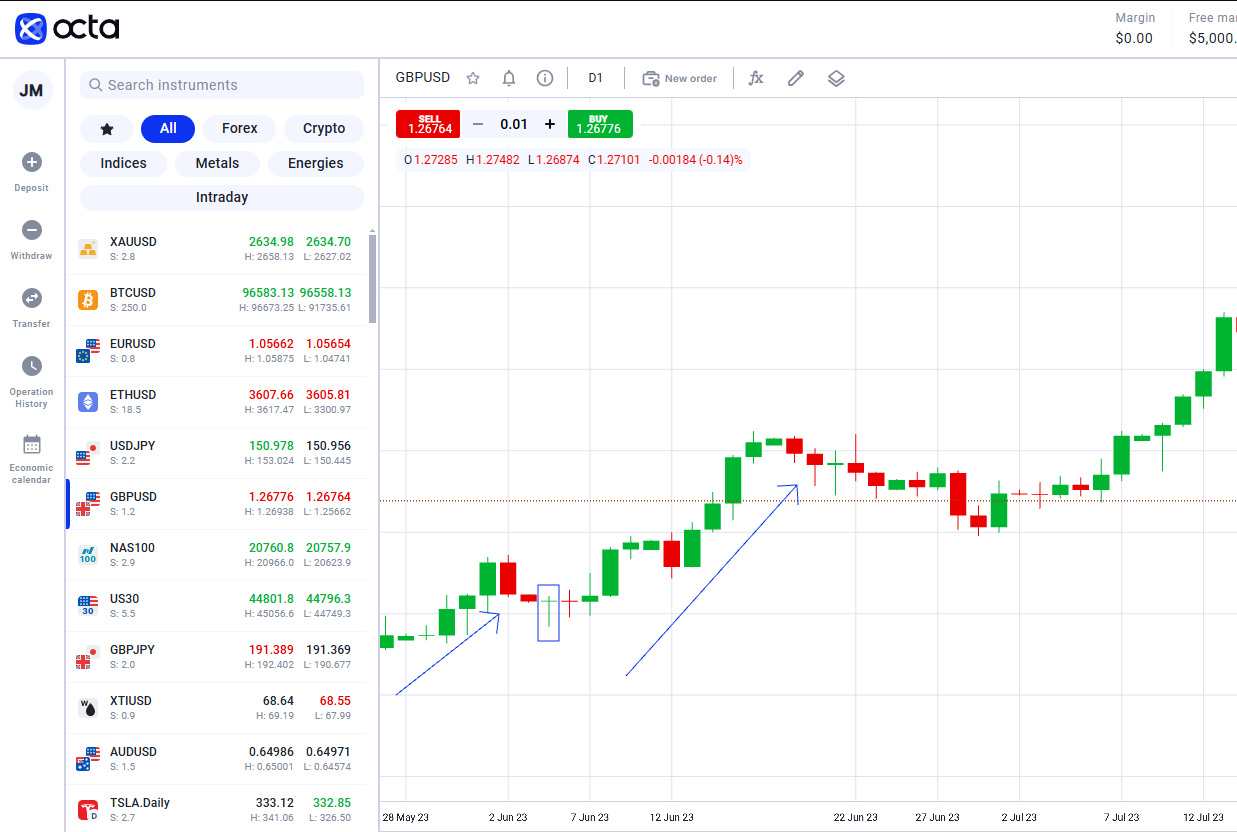
Let's say you're looking at a chart for a currency pair, like the euro against the US dollar (EURUSD). One day, you notice a Dragonfly Doji pattern forming. It happens when the price opens, drops down a bit, but then rallies back up to close at the same level where it opened. This pattern suggests buyers are starting to take control after a downward trend, which might mean the price could go up soon. If you see this pattern, you might think about buying euros, hoping their value will rise against the dollar.
Imagine seeing another Dragonfly candlestick on a different currency pair, like the British pound against the Japanese yen (GBPJPY). The same thing occurs: the price drops but then bounces to close near the opening level. Traders see this as a sign of potential reversal, meaning the currency might stop going low and start a bullish trend. If you buy GBPJPY after spotting this pattern, you bet the pound will gain strength against the yen. Remember, while these patterns can hint at what might happen next, they aren't foolproof, so it's better to combine them with other tools or strategies.
When you spot a Dragonfly Doji after prices have dropped, it usually means that people are no longer selling. It could be a sign that prices might go up again. It is essential for traders because it helps them see when the market might change. If they catch these signs early, they can make some profit. For example, if they see a Dragonfly Doji candlestick, they might decide to stop selling it (closing short positions) because they think prices are about to rise. Or they might want to start buying more (entering a long position) if they see other signs supporting the idea of increasing prices. To trade using a Dragonfly Doji, you need to have a solid trading plan that includes this pattern. First, check if the currency price is generally going down. You can do this by looking for a trendline that shows the direction. Next, find support levels below the current price: these are spots where the price usually stops dropping and could bounce back up. Once you've marked these support levels, watch for this pattern to appear near them. If it does, that's a good sign to consider buying. After confirming the pattern, you would place a buy order at the opening price of the next candle. To protect yourself from losing too much money, set a stop loss just below the lowest point of the Dragonfly Doji. This way, if the currency price drops too much, it will automatically sell to help minimise your losses. Before you buy, decide how much profit you want to make and set a target just below where the price might struggle to go higher. After you make the trade, watch how the currency price is doing. Watch for signs of it going up or if your stop loss gets triggered.How to trade using the Dragonfly Doji pattern
Remember, while the Dragonfly Doji is helpful for traders, it can sometimes be wrong. Using it along with other tools like RSI or moving averages is recommended. The Relative Strength Index (RSI) is like a mood ring for the market. If the RSI shows that the price is in the 'oversold' region (meaning everyone is feeling negative), and then a Dragonfly Doji appears, it suggests that prices could start to rise again. The Moving Average Convergence Divergence (MACD) is like a scoreboard for momentum. If the MACD line crosses above another line when a Dragonfly Doji shows up, it's another clue that prices might be getting ready to go up.
The best time to trade with a Dragonfly Doji is after a slight drop in a generally rising trend.
Final thoughts
