What is a Hanging Man candlestick pattern?
The structure of the Hanging Man pattern
Shooting Star, Hammer and Hanging Man patterns: comparison
Advantages of the Hangman candlestick for market analysis
Disadvantages of the Hanging Man candlestick pattern
How to trade the Hanging Man pattern
When is the best time to trade the Hanging Man pattern?
If you're a trading enthusiast, you've seen lots of different candlestick patterns before. They're visual signals on a chart that help traders understand price movements. One pattern that stands out is called the Hanging Man. It resembles a little stick figure hanging. If you don't know how to spot this pattern or its meaning, you might miss some vital signs that could help you make money while trading. This article explains everything about the Hanging Man pattern so you'll know how to recognise it and what it could mean for your trading strategy.
What is a Hanging Man candlestick pattern?
The Hanging Man, sometimes called the Hangman, usually appears after prices have been bullish for a while. When traders see this pattern, they expect the excitement for buying to fade. In turn, this could mean that prices will start to drop soon.
When traders spot a Hanging Man, it's a heads-up to be careful because the market might change direction and not go up anymore.

1.The body is black (or red) if the price closed lower and white (or green) if it closed higher.
a. The highest price for the day
b. Opening price
c. Closing price
d. The lowest price for the day
This pattern can be helpful for traders when they're analysing prices. Here's what makes it unique:
- Shape. Imagine a little person figure hanging. That's what it looks like. The small body of the figure shows where the price opened and closed, while the long line hanging down is called a shadow.
- Occurrence. This pattern usually appears after the market has been bullish for some time. It's a sign that the trend might change soon.
- Shadow. The long shadow tells us that sellers pushed the price down at some point during the trading day. But then, some buyers jumped in and pushed the price back up, so it ended up being close to where it started.
- Meaning. When traders see the Hanging Man, it makes them cautious. They often wait to see what happens next. If the prices start going down afterwards, it signals that a price drop might be happening.
It is important to remember that the colour of the Hanging Man's body isn't significant. What matters is that the body is relatively small compared to the lower shadow.
The structure of the Hanging Man pattern
Here's how you can quickly spot the Hanging Man pattern:
- Examine the candlesticks. They are single vertical bars on a chart showing how the price changed over a specific timeframe.
- Find the one with a small body at the top. This candle will have a little part called the 'body' at the top. It shows where the price opened and closed during that time.
- Make sure it also has a long shadow below. There will be a long line ('shadow') that stretches down at least twice as long as the body. This is a crucial feature of the Hanging Man. The long shadow indicates that sellers acted aggressively during the formation of the candle, pushing the open, close, and high prices significantly above the low.
The Low and High of the candle (or trading day) represent the extreme ends of the price range for that day. There may or may not be a wick; if there is one, it will be small.
This pattern usually comes up after a series of candles going up, which we call 'bullish'. When you see the Hanging Man, it might mean that sellers are starting to take control, suggesting that prices could drop.
After spotting the Hanging Man, don't jump to conclusions right away. You should wait and watch for more signals. If another candle that also shows the price going down appears, it's a stronger sign that a price drop is likely to happen.
Shooting Star, Hammer, and Hanging Man patterns: comparison
Here are the main differences between the patterns heavily used by traders, including the Hanging Man candlestick pattern.
|
Pattern Name |
Appearance |
Position |
Meaning |
| Shooting Star | A Shooting Star candle has a small body at the bottom and a long line (shadow) sticking up from the top. | This pattern usually shows up after prices have been going up for a while, like when a currency was getting stronger. | When traders spot a Shooting Star, it’s a sign for them that the upward trend might be ending. The long upper shadow indicates that the price went really high during the day but then dropped back down to close near where it started. This can suggest that the buyers pushing the price up may be running out of energy, and sellers could start taking charge, leading to a potential drop in prices. |
| Hammer | The candlestick has a small body at the top and a long line (shadow) sticking down from the bottom. It looks like a hammer with a long handle. | The Hammer candle usually shows up after prices have been going down for a while, like when a currency's price has been dropping. | When traders spot a Hammer, it suggests that the downtrend might be turning around. The long lower shadow indicates that even though the price dropped a lot during the day, it came back up to close near where it started. This could mean that the sellers pushing the price down might be losing control, and buyers could begin taking over. As a result, prices might start going up again. |
| Hanging Man | The candlestick has a small body at the top and a long shadow sticking down from the bottom. It looks like a person hanging upside down. | The Hanging Man candle often shows up after prices have been going up for a while, like when the market has been doing well. | When traders spot a Hanging Man, it suggests that the upward trend might be about to change. The long lower shadow indicates that even though the price dropped a lot during the day, it came back up to close near where it started. This could mean that the buyers pushing the price up might be losing control, and sellers could start taking over. As a result, prices might start going down instead of up. |

1. Hammer
2. Hanging Man
3. Shooting Star
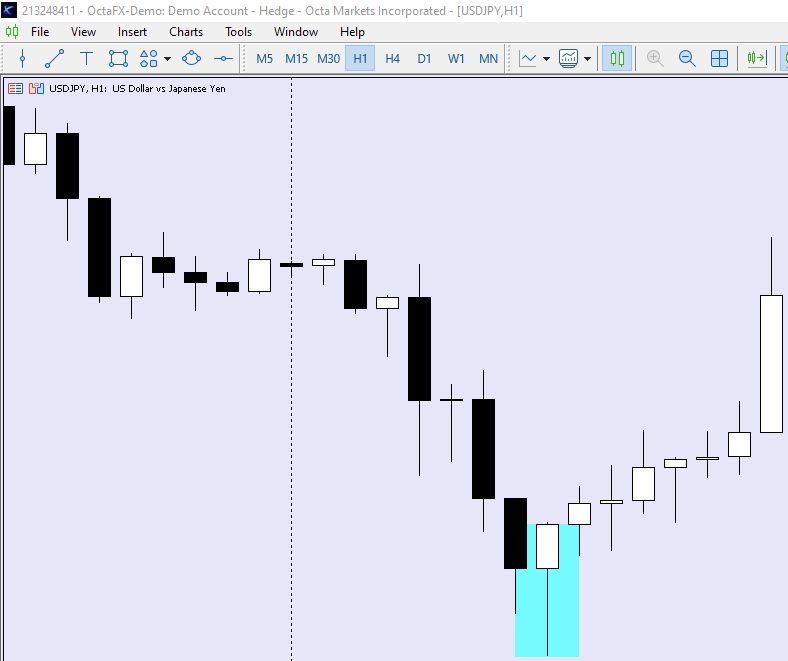
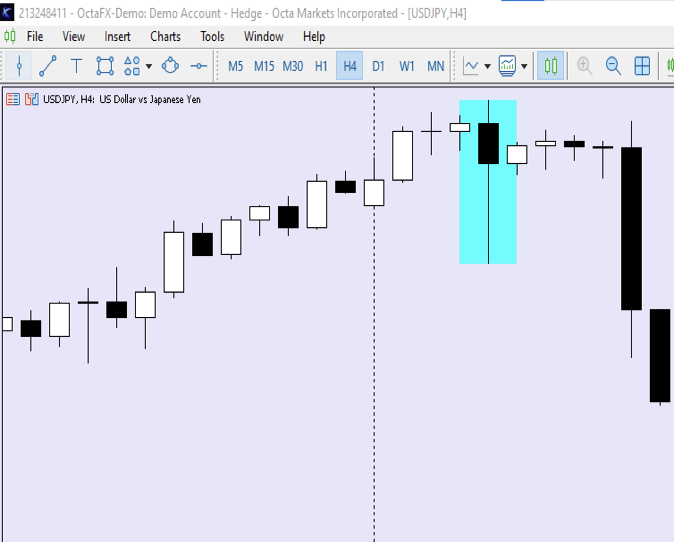
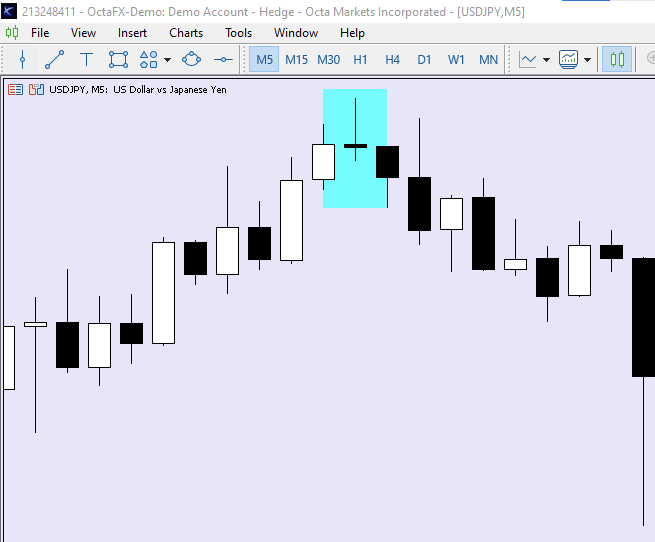
Let’s have a look at these patterns in the charts below:

Hammer

Hanging Man

Shooting Star
Advantages of the Hangman candlestick for market analysis
One of the crucial factors about the Hangman pattern is that it's super easy to spot. This means both beginners and experienced traders can use it without fancy indicators or complicated strategies.
Also, traders can blend the Hanging Man pattern with other trading methods. By doing so, they can make smarter choices about when to buy or sell currencies.
Whether you're just getting started or have been trading for a while, the Hanging Man is a helpful pattern to keep in your toolkit.
Disadvantages of the Hanging Man candlestick pattern
The Hanging Man pattern can be helpful, but it's not perfect. Sometimes, it might look like prices will drop, but the bullish trend continues. This is called a 'false signal’.
The problem is that the market can change significantly for different reasons.
It's essential for traders not to rely on the Hanging Man candle alone. They should also look at other signs and consider how the market performs. If they only focus on the Hanging Man and ignore everything else, they could miss chances to make money or even lose their funds.
That's why it's advisable for traders to be cautious and use the Hanging Man pattern as just one part of their bigger trading plan.
How to trade the Hanging Man pattern
The Hanging Man pattern tells traders that the market direction might change soon. Usually, it appears after prices have been going up for a while. When traders spot this pattern, they consider that the prices might stop going up and could start going down instead.
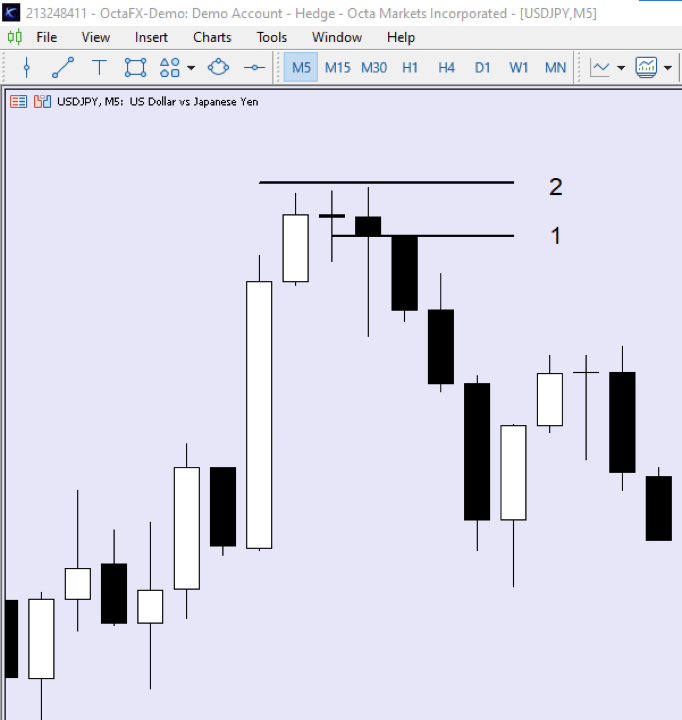
When you spot this pattern, consider starting a short (sell) trade near the close of the bearish candle that follows the Hanging Man. For a more aggressive approach, consider entering near the close of the Hanging Man candle or at the opening of the next candle. Set a stop-loss order just above the high of the Hanging Man candle. The chart below illustrates the potential entry points and the stop loss placement.

1 – Potential entry point
2 – Stop loss

1. Stop loss
2. Exit as price moves higher
When is the best time to trade the Hanging Man pattern?
Although this pattern happens across all timeframes, it's a good idea to look for it on daily or weekly charts as they usually give more precise signals. Also, it's smart to look at other signs, like how much trading is happening or where prices have gone up and down. This helps you be more confident in your decision.
When you spot the Hanging Man pattern and other signs that support it, it's wise to wait a little before making your trade. This can help you reduce risks and potentially even make more profit.
Final thoughts
- The Hanging Man candlestick is a distinct pattern that traders look for to identify potential market reversals. It looks like a candle with a small body and a long shadow hanging down.
- The Hangman suggests that traders might start selling their positions soon. This could mean that prices might not keep going up and begin to go down.
- Sometimes, this pattern can be misleading. Prices might actually keep going up instead of reversing, as the Hanging Man suggests. That's why traders usually wait to see more signs, for example, other bearish candles before they decide on their next move.
- While the Hanging Man can give a clue that things might change in the market, it's always best to use it along with other signals to make smart trading decisions.


